The Hidden Costs of Inefficient Processes: A Strategic Analysis for 2026
- jonesaqayalo
- Jun 20
- 11 min read
Updated: Jul 5
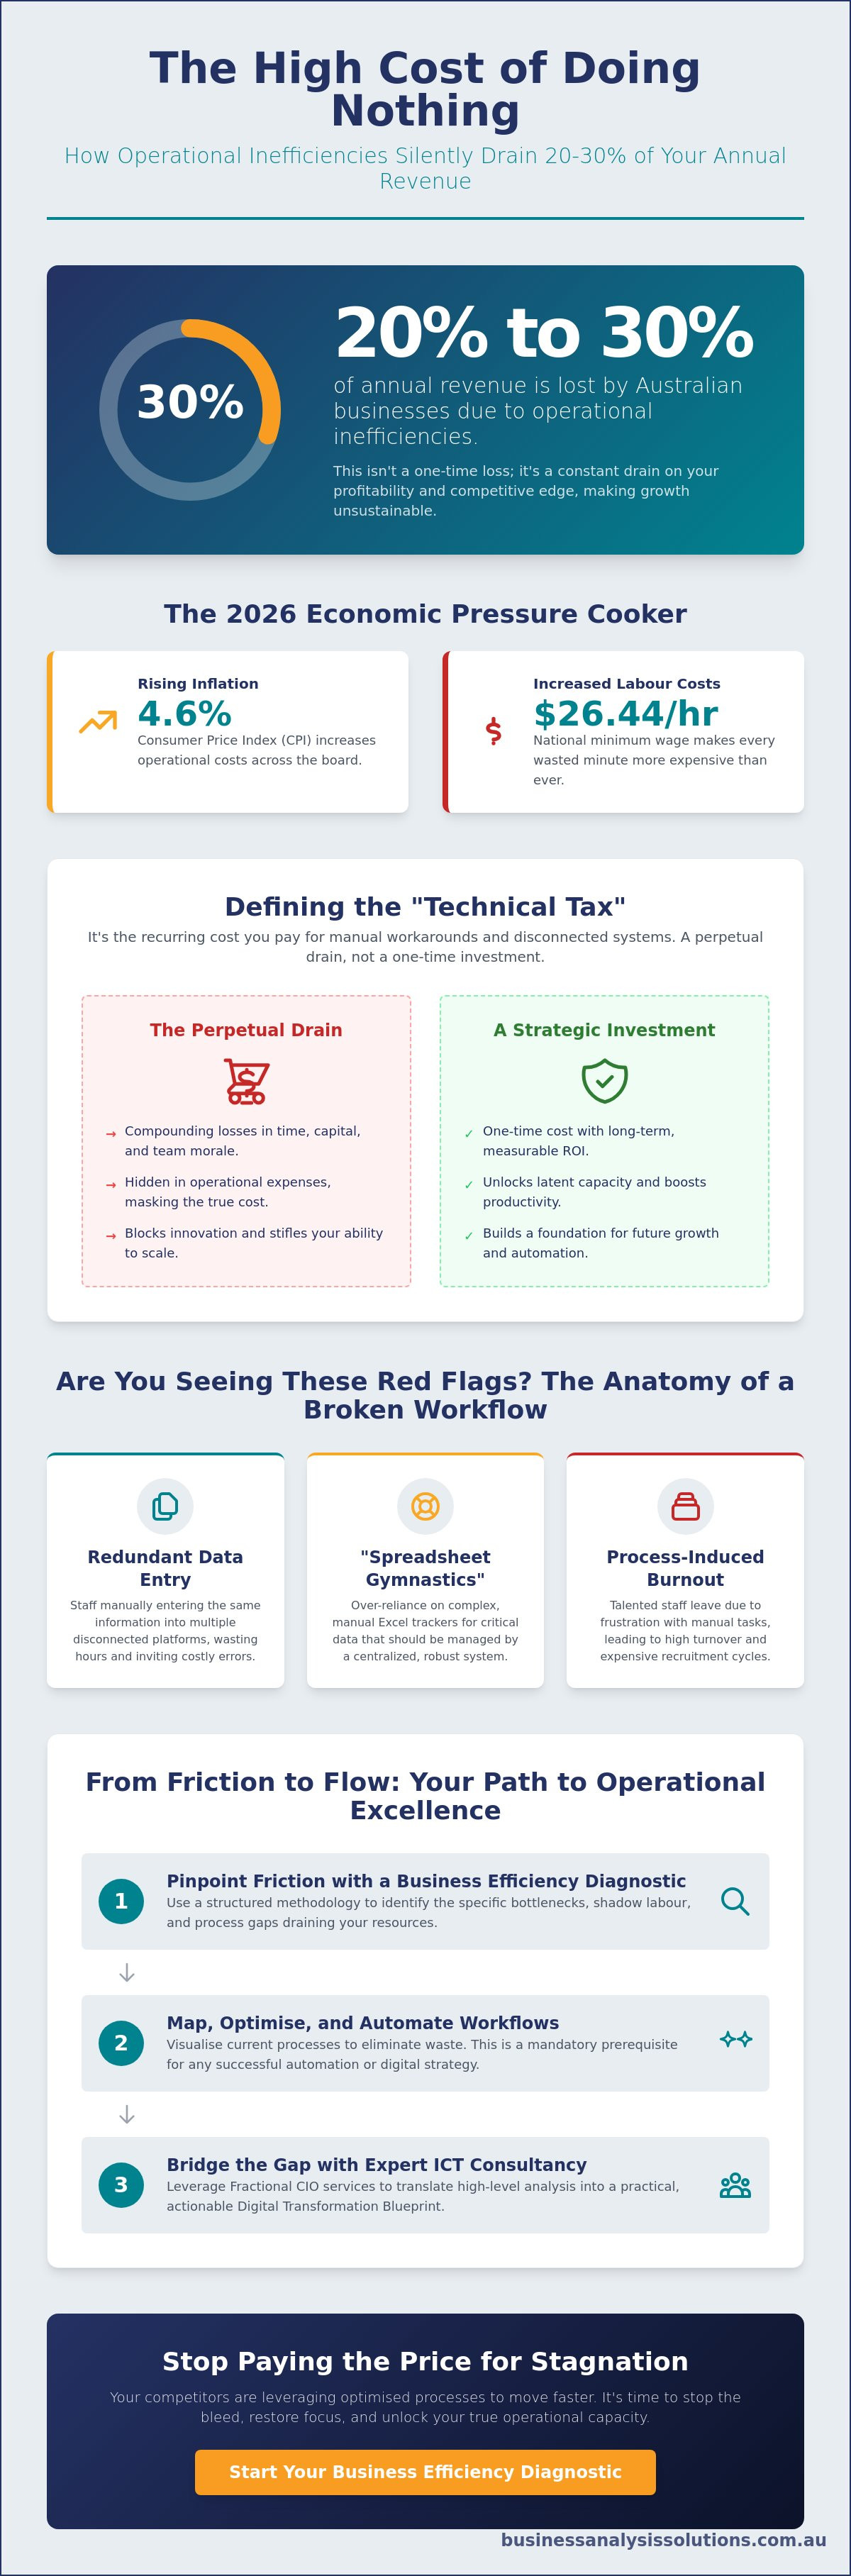
Recent data confirms that operational inefficiencies cost Australian businesses between 20% and 30% of their annual revenue. In a 2026 fiscal environment where the CPI has reached 4.6% and the national minimum wage has increased to $26.44 per hour, these losses are no longer sustainable. If your organization is struggling with the hidden costs of inefficient processes, you're essentially paying a steep premium for stagnation.
You've likely noticed the symptoms already: rising operational overheads that don't lead to growth, frequent project delays, and talented staff leaving due to burnout from manual tasks. It's frustrating to watch technical debt accumulate while your competitors leverage AI to move faster. You know that a more methodical approach is required to stop the bleed and restore focus to high-value objectives.
This strategic analysis will show you how to identify and quantify these silent financial drains to unlock latent operational capacity. We'll provide a clear framework to isolate waste, justify a digital transformation investment, and improve your profit margins. We'll examine the path from process mapping to a full Digital Transformation Blueprint, ensuring your organization achieves the agility needed to thrive in the current economic climate.
Table of Contents
Defining Inefficient Processes: The 'Technical Tax' on Australian Business
In a professional context, an inefficient process is any workflow that consumes more resources—be it time, capital, or cognitive energy—than is strictly required to achieve the desired outcome. Efficiency is not merely about speed; it is about the precision of resource allocation. When a process is poorly designed, it creates a "Technical Tax." This is the recurring cost an organisation pays to maintain manual workarounds and bridge the gaps between disconnected systems. Unlike a one-time investment in ICT solutions, this tax is a perpetual drain on your balance sheet that compounds over time.
Standard financial reporting frequently fails to capture the true scale of the hidden costs of inefficient processes. Most accounting software categorises labour as a fixed operational expense. It does not distinguish between time spent on value-add strategic work and time lost to friction. Consequently, leadership may see a productive workforce "working hard" while the actual profit margins suggest otherwise. In the 2026 economic environment, where the national minimum wage has risen to $26.44 per hour, the distinction between working hard and working effectively has become a critical survival metric.
The Anatomy of a Broken Workflow
Broken workflows are rarely the result of a single catastrophic failure. Instead, they manifest as a series of small, persistent frictions that degrade organisational performance. Common indicators include:
Redundant data entry: Employees manually entering the same information into multiple, disconnected software platforms because systems lack integration.
Ambiguous decision-making: A lack of clear hierarchies or defined process triggers that leads to project stagnation and "analysis paralysis."
Spreadsheet gymnastics: The heavy reliance on complex, manual Excel trackers to manage data that should be handled by a centralised system.
These symptoms indicate that your current operating model is no longer fit for purpose, creating hidden costs of inefficient processes that siphon away your competitive advantage.
Why Familiarity Breeds Inefficiency
There is a significant psychological component to process decay. Often, teams fall into the trap of "we have always done it this way," confusing familiarity with stability. When a process feels comfortable, staff are less likely to question its logic, even as it becomes increasingly obsolete. This leads to the implementation of incremental "patches"—small manual fixes to old problems—that eventually create a labyrinth of complexity. A stable process is one that is consistently optimised for the current environment; a stagnant process is one that has been left to rot under the guise of tradition. Recognising this difference is the first step toward meaningful digital strategy and structural resolution.
Quantifying the Financial Drain: Labour, Errors, and Rework
Quantifying the financial impact of broken workflows requires moving beyond obvious overheads and examining the compounding variables that erode profitability. In the 2026 Australian market, where operational inefficiencies typically drain 20% to 30% of annual revenue, these losses represent a severe competitive disadvantage. The hidden costs of inefficient processes are most visible when we analyse how labour is actually utilised versus how it's reported on a balance sheet. When workflows aren't optimised, you aren't just losing time; you're actively subsidising waste.
The Labour Cost of Manual Intervention
Shadow labour is the unrecorded time employees spend bypassing broken systems. This invisible effort occurs every time a staff member manually cross-references data or creates a personal tracker to compensate for inadequate software capabilities. When you calculate the Full-Time Equivalent (FTE) waste across administrative bottlenecks, the figures are often staggering. For a mid-sized firm, even a 10% loss in productivity due to manual intervention equates to thousands of dollars in wasted wages every week, particularly with the national minimum wage now at $26.44 per hour. Beyond the immediate payroll loss, these frustrations drive process-induced burnout. High staff turnover leads to significant recruitment and training expenses, further inflating the total cost of maintaining the status quo.
The Price of Poor Data Integrity
Inefficient processes are the primary source of "dirty data." When workflows rely on manual intervention, the risk of data errors increases exponentially. These errors create immediate financial risks through incorrect reporting and potential compliance failures with regulatory bodies. Perhaps more critically for 2026, poor data integrity undermines future AI initiatives. Since 69% of Australian SMEs are now using AI, those with fragmented data will find themselves unable to leverage these tools effectively. This creates a "Rework Multiplier" where fixing a single data error after the fact costs ten times more than preventing it through an optimised workflow. It's a fiscal drain that compounds with every manual touchpoint.
Finally, consider the cost of delayed time-to-market. When internal approvals or production steps are mired in manual checks, your ability to launch new services is compromised. In a high-inflation environment with a 4.6% CPI, every week of delay represents lost revenue and eroded market share. Identifying these drains through a professional Business Efficiency Diagnostic allows leadership to transition from reactive firefighting to strategic resource allocation. By resolving these frictions, organisations unlock the capital required for genuine innovation and growth.
The Innovation Barrier: How Bad Processes Block Digital Transformation
Applying technology to a broken workflow does not resolve the underlying issue; it merely accelerates it. For many organisations, the primary hurdle to growth isn't a lack of software but the structural decay within their existing operations. Successful automation implementation is fundamentally impossible without first conducting rigorous process mapping and optimisation. Without this foundation, you risk "Digital Paving," which is the expensive mistake of digitising a flawed process rather than re-engineering it for modern requirements. This approach ensures that you don't just do things faster, but that you do the right things.
The "Garbage In, Garbage Out" (GIGO) principle remains the most relevant rule in digital strategy. If your internal workflows are mired in manual workarounds and fragmented data, advanced tools like Microsoft Copilot or custom AI integrations will fail to deliver value. These technologies depend on clean, structured data and logical process triggers to function. When these are absent, the hidden costs of inefficient processes manifest as failed IT projects and wasted licensing fees for tools your team cannot effectively use. Precision in your underlying data architecture is the only way to turn AI from a buzzword into a functional asset.
Technical Debt and System Fragmentation
System fragmentation occurs when siloed departments develop their own "ICT islands" that fail to communicate. These disconnected platforms create significant technical debt, forcing staff to act as manual bridges between software. Maintaining legacy systems that no longer align with your organisational goals is a drain on both capital and focus. This is why comprehensive digital transformation blueprints must prioritise process mapping as the initial phase of any technological shift. Resolution requires a unified view of how data flows across the entire enterprise.
The Opportunity Cost of Stagnation
In a fluctuating 2026 Australian market, organisational agility is a prerequisite for survival. Businesses burdened by rigid, manual workflows cannot pivot quickly enough to respond to supply chain disruptions or shifts in consumer demand. While your competitors leverage automated reporting and real-time analytics to seize market share, your leadership remains trapped in administrative minutiae. This stagnation prevents you from exploring new revenue streams or improving customer experiences. The greatest hidden cost is the revenue you never generated because your team was too busy with manual tasks.
Identifying the Friction: The Business Efficiency Diagnostic
Resolving the structural issues that lead to financial leakage requires more than anecdotal evidence; it demands a data-driven methodology. The Business Efficiency Diagnostic serves as this formal framework, providing an objective assessment of an organisation's operational health. By identifying specific "Friction Points"—areas where workflows slow down or stop entirely—leadership can pinpoint the exact origin of their hidden costs of inefficient processes. This discovery process involves a combination of deep stakeholder interviews and rigorous data analysis to separate perceived problems from actual systemic failures. We look for patterns in error rates, processing times, and resource allocation to build a comprehensive map of operational drag.
A cornerstone of this diagnostic is process mapping. Visualising a bottleneck often reveals redundancies that remain invisible during day-to-day operations. When a workflow is laid out visually, the logical inconsistencies become impossible to ignore. Once these maps are finalised, the transition from diagnostic findings to a strategic action plan becomes logical and evidence-based. This ensures that every subsequent investment in technology or structural change is directly linked to a quantified efficiency gain, moving the organisation toward a state of high-performance harmony.
Signs Your Organisation Needs a Diagnostic
Organisations often ignore the warning signs of process decay until they reach a crisis point. One of the most common indicators is a consistent reliance on "heroics" from specific staff members. When success depends on individuals working excessive hours to overcome system gaps, the process itself is failing. Another red flag is a widening gap between what your technical systems can do and what the business actually requires. If your team cannot produce real-time reports without hours of manual data consolidation, you're paying a high price for outdated workflows and the hidden costs of inefficient processes are likely escalating.
The Steps of a Professional Process Audit
A professional audit follows a structured sequence to ensure no detail is overlooked. First, we inventory current state workflows to identify "as-is" pain points. This involves documenting every manual touchpoint and decision trigger. Next, we quantify the time and cost associated with each step, using the 2026 national minimum wage of $26.44 per hour as a baseline for calculating labour waste. Finally, we define the "to-be" state—a streamlined model that aligns with current technology standards and organisational objectives. This roadmap provides the clarity needed to execute change with confidence and precision.
If you're ready to eliminate operational friction and restore your margins, explore our full range of Business Analysis services today.
Strategic Resolution: Bridging the Gap with Expert ICT Consultancy
Once you have quantified the hidden costs of inefficient processes through a diagnostic phase, the focus must shift toward structural resolution. Identifying waste is a prerequisite, but capturing that lost value requires a methodical alignment of technology and business objectives. In the current 2026 economic climate, organisations cannot afford to invest in ICT solutions that fail to address the root causes of operational drag. Resolution requires a bridge between high-level executive vision and the granular technical requirements of the workforce.
Successful automation projects also demand rigorous project management to deliver a measurable return on investment. Without a disciplined framework to manage timelines, resources, and stakeholder expectations, even the most advanced technical solutions can become another source of technical debt. By maintaining a focus on the desired business outcome throughout the implementation lifecycle, organisations ensure that their digital transformation efforts translate into improved profit margins and enhanced organisational agility.
The Role of the Fractional CIO
One of the most effective ways to achieve executive-level technology alignment is through Fractional CIO services. This model provides organisations with access to high-level IT advisory and strategic leadership without the overhead of a full-time executive salary. A Fractional CIO ensures that technology investments are not made in isolation but are designed to support broader efficiency goals. They play a vital role in bridging the communication gap between technical teams and business leadership, ensuring that the technology roadmap remains focused on delivering tangible value.
Implementing a Digital Transformation Blueprint
The transition from diagnostic insights to operational reality is formalised through a Digital Transformation Blueprint. This document outlines a phased, risk-managed path for upgrading systems and workflows. By prioritising automation projects based on a clear cost-benefit analysis, leadership can address the most significant hidden costs of inefficient processes first. This phased approach allows the organisation to realise incremental gains while managing the complexities of change. It is essential that organisational change management accompanies these technical shifts to ensure staff adoption and long-term process stability.
Efficiency is not a static destination but a continuous improvement cycle. As market conditions and technology standards evolve, your processes must remain under constant review to prevent the re-emergence of technical debt. By fostering a culture of operational precision and leveraging expert consultancy, your organisation can maintain its competitive advantage and drive sustainable growth well beyond 2026.
Strategic Operational Alignment for 2026
Operational efficiency is no longer a luxury; it's a prerequisite for survival in a high-inflation economy. We've established that the hidden costs of inefficient processes manifest as a technical tax that drains revenue and blocks innovation. By quantifying shadow labour and identifying friction points through a structured diagnostic, you can transition from reactive firefighting to proactive strategic growth. This methodical approach ensures your organisation is built on a foundation of precision rather than manual workarounds.
With over 20 years of industry experience, we're specialised in bridging the gap between business needs and ICT solutions. Our proven methodology for Digital Transformation Blueprints provides the clarity needed to navigate complex structural changes with confidence and poise. It's time to stop subsidising waste and start unlocking your team's true potential through logical, results-driven optimisation.
Book a Business Efficiency Diagnostic with our expert consultants today.
Reclaiming your operational capacity is an achievable goal when you apply the right analytical framework. We look forward to helping you build a more agile and profitable future.
Frequently Asked Questions
What are the most common signs of inefficient business processes?
Common indicators include redundant data entry across multiple systems, high error rates requiring frequent rework, and a heavy reliance on specific staff members to "save the day." If your team can't scale its output without a linear increase in headcount, your underlying workflows are likely no longer fit for purpose. These symptoms suggest that your current operating model is consuming more resources than necessary to achieve its objectives.
How do I calculate the dollar value of lost productivity in my team?
Identify the specific non-value-add tasks your team performs and multiply the total weekly hours spent on these activities by the average hourly labour rate. This calculation reveals the hidden costs of inefficient processes by quantifying "shadow labour" that typically remains invisible on a standard profit and loss statement. This data provides the financial justification needed for a targeted Business Efficiency Diagnostic.
Can technology alone fix an inefficient process?
No; technology is an accelerant that will only amplify the existing state of your operations. Applying software to a broken workflow merely digitises the friction, leading to "digital paving" where flaws are baked into your new systems. You must map and optimise the process manually before any automation implementation can deliver a genuine return on investment.
What is a Business Efficiency Diagnostic and how long does it take?
A Business Efficiency Diagnostic is a formal methodology used to identify organisational friction points and quantify operational drag. It involves stakeholder interviews, data analysis, and process auditing to build a clear picture of your current state. Depending on the size of your organisation and the complexity of the workflows involved, a diagnostic typically spans two to four weeks from initial discovery to final reporting.
Why is process mapping important for digital transformation?
It creates a visual blueprint of how data and resources move through your organisation, exposing bottlenecks that aren't apparent in daily operations. This visibility is crucial for a Digital Transformation Blueprint because it identifies which steps are redundant and which are essential. Without an accurate map, you're essentially guessing where technology will have the most significant impact on your profit margins.
What is the difference between an IT consultant and a Fractional CIO?
An IT consultant is typically engaged for specific, technical project delivery or troubleshooting. A Fractional CIO provides high-level strategic leadership, bridging the gap between your technical requirements and broader business objectives. They ensure that your long-term digital strategy remains aligned with financial performance goals, providing executive-level advisory without the cost of a full-time hire.
How does process inefficiency impact customer satisfaction?
Inefficiency manifests externally as longer lead times, inconsistent service quality, and communication errors. When your internal workflows are mired in manual checks and disconnected systems, the customer often experiences the friction as a lack of responsiveness. Resolving these internal issues is often the most direct way to improve the end-to-end customer experience and increase retention rates.
What are the risks of automating a bad process?
Automating a flawed process scales the hidden costs of inefficient processes by generating errors at a much higher velocity. This creates a "Garbage In, Garbage Out" scenario where your systems produce unreliable data that undermines your business intelligence. It also makes future corrections more difficult and expensive, as you'll eventually have to deconstruct the automation to fix the underlying structural problem.



Comments