How to Measure Business Efficiency: A Strategic Framework for 2026
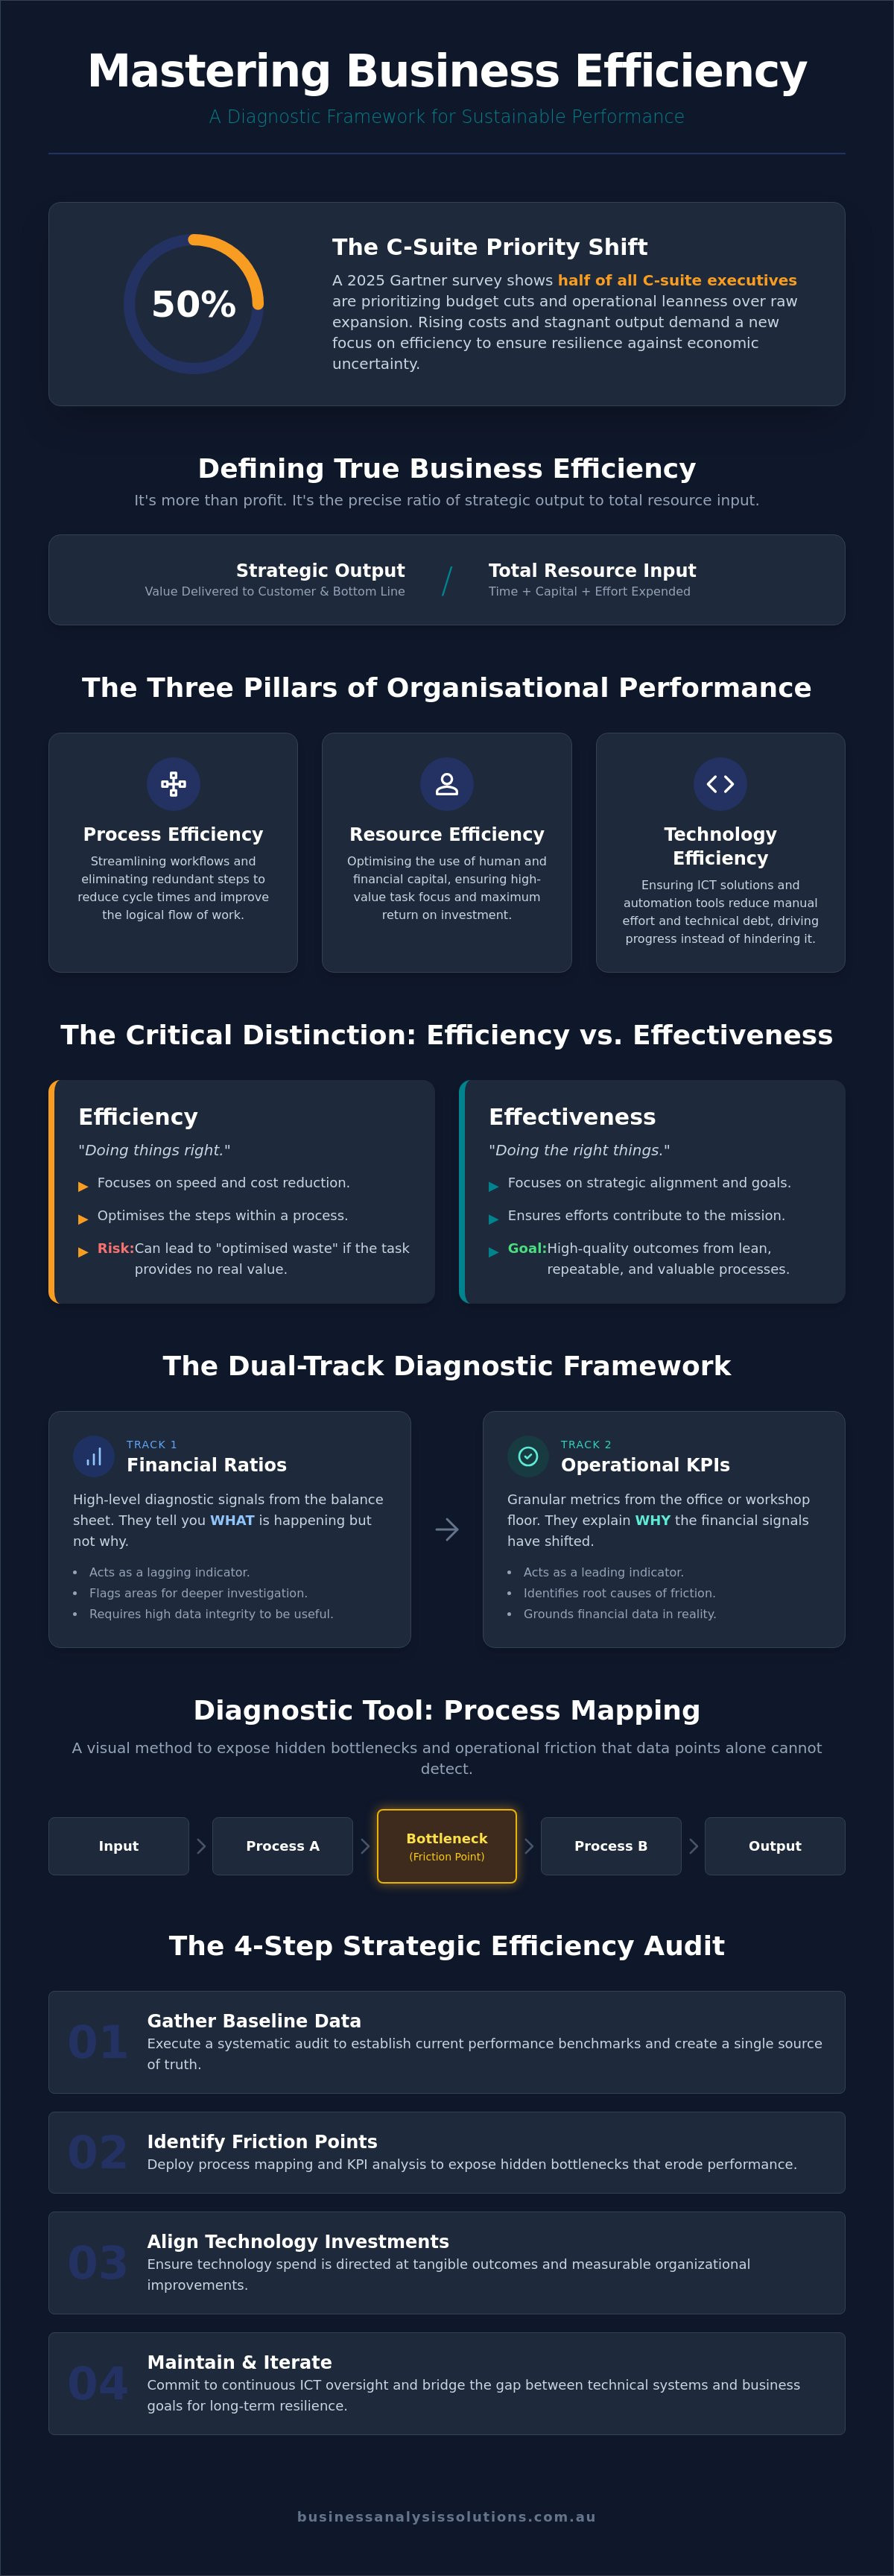
A 2025 Gartner survey reveals that 50% of C-suite executives are prioritizing budget cuts and operational leanness over raw expansion. You likely feel this shift as rising operational costs eat into your margins while output remains stagnant. Understanding how to measure business efficiency is no longer a peripheral task for the finance team. It's a core requirement for any leader navigating the 3.62% federal funds rate environment of 2026. Precision in performance tracking is the only way to ensure your organization remains resilient against economic uncertainty.
Fragmented data and legacy processes often create a veil of complexity that makes true performance difficult to isolate. We'll provide a structured framework to master the metrics and diagnostic methodologies required to identify operational friction and drive measurable results. You'll gain a clear list of actionable KPIs, a methodical approach for conducting a business diagnostic, and a strategy to align your technology spend with tangible outcomes. By the end of this guide, you'll have the tools to bridge the gap between technical requirements and broader organizational objectives, ensuring every process contributes to system harmony and financial performance.
Table of Contents
What is Business Efficiency and Why Does it Require a Diagnostic Approach?
Business efficiency represents the precise ratio of strategic output against the total resource input of time, capital, and effort. While financial statements provide a snapshot of results, they often mask the underlying friction that erodes long-term performance. Understanding how to measure business efficiency requires looking past surface-level profit to evaluate deep-layer operational health. A profitable company can still harbor significant waste. This waste remains invisible until a structured diagnostic approach is applied to the entire value chain.
The "Efficiency Gap" is a critical concept for modern leadership. It defines the variance between an organization's current performance and its theoretical capacity. Closing this gap isn't achieved through simple spreadsheet tracking, which merely records historical data. Instead, a comprehensive business efficiency diagnostic identifies the root causes of friction. This methodical evaluation moves beyond descriptive analytics to prescriptive action. It ensures that every unit of input generates the maximum possible value rather than being consumed by redundant processes.
Efficiency vs. Effectiveness: The Strategic Distinction
Efficiency is often described as "doing things right," focusing on speed and cost reduction. Effectiveness, however, is "doing the right things," or ensuring that efforts align with strategic objectives. Measuring efficiency in isolation often leads to "optimised waste." This occurs when a team becomes exceptionally good at performing a task that provides no actual value to the customer or the bottom line. Operational efficiency must be balanced with strategic intent to ensure resources aren't just spent quickly, but wisely. For Australian leadership, the synergy between these two concepts lies in the ability to deliver high-quality outcomes through lean, repeatable processes that directly support the organization's mission.
The Three Pillars of Organisational Performance
To determine how to measure business efficiency effectively, leadership must monitor three distinct pillars that support the broader corporate structure:
Process Efficiency: This involves streamlining workflows and eliminating redundant steps to reduce cycle times. It focuses on the logical flow of work through the system.
Resource Efficiency: This pillar focuses on optimising the use of human and financial capital. It ensures that staff are focused on high-value tasks and that capital is allocated where it yields the highest return.
Technology Efficiency: In a digital-first environment, ICT solutions must drive progress rather than hinder it. This means ensuring that software and automation tools actually reduce manual effort rather than adding layers of technical debt.
By assessing these pillars through a diagnostic lens, an organization can move from reactive troubleshooting to proactive optimization. This structured approach provides the clarity needed to bridge the gap between technical requirements and overarching business goals.
The Dual-Track Framework: Financial Ratios and Operational KPIs
Efficiency is not a static figure found on a single report. It's the result of a synchronized relationship between financial outcomes and the processes that drive them. To master how to measure business efficiency, leaders must adopt a dual-track framework. This approach links balance sheet metrics directly to daily operational activities, ensuring that high-level financial signals are grounded in the reality of the workshop or office floor. When these two tracks are separated, leadership often finds itself reacting to lagging indicators without understanding the underlying friction.
Financial data serves as the primary diagnostic signal. A sudden shift in a specific ratio often flags an area requiring deeper process investigation. However, data integrity is paramount. If the underlying data is fragmented or manually entered, the resulting metrics may reflect human error rather than operational reality. This practical guide to measuring business efficiency emphasizes that while financial ratios identify that a problem exists, they rarely explain why. The "why" is found in the operational track. Leveraging modern business technology to automate data collection ensures that these insights are both accurate and actionable.
Financial Efficiency Ratios Every Leader Should Track
Inventory Turnover: This measures the speed of the supply chain engine. It calculates how many times a company has sold and replaced its inventory during a specific period. Low turnover suggests capital is trapped in stagnant stock.
Accounts Receivable Turnover: This assesses the efficiency of capital recovery. It indicates how effectively the organization manages credit and how quickly it collects payments from clients.
Revenue per Employee: This is a high-level indicator of human capital productivity. It helps determine if the current organizational structure and technology stack are empowering the workforce to deliver maximum value.
Operational KPIs for Daily Performance Oversight
Cycle Time: This tracks the total time required to complete a specific business process from start to finish. Reducing cycle time is a direct path to increasing how to measure business efficiency across the enterprise.
Error Rates: This measures the frequency of rework and quality failures. High error rates are a primary driver of operational waste and customer dissatisfaction.
Throughput: This monitors the volume of successful outputs produced within a set timeframe. It reveals whether the system is operating at its theoretical capacity or if bottlenecks are impeding progress.
By linking these two tracks, leadership gains a clear view of where technology spend and process design intersect with financial results. If you find your operational KPIs are slipping despite high technology investment, a Business Efficiency Diagnostic can provide the objective clarity needed to identify and resolve the disconnect.
Using Process Mapping to Uncover Efficiency Bottlenecks
Financial ratios and operational KPIs identify that a performance gap exists, but they cannot visualize the specific friction points within a workflow. Business process mapping acts as a diagnostic tool that translates abstract data into a visual architecture. By documenting every step of a task, leadership can see redundant hand-offs and approval loops that metrics alone miss. This visualization is essential for understanding how to measure business efficiency beyond the balance sheet. It reveals "shadow processes", which are the informal, unrecorded workarounds employees create to bypass broken systems. These hidden activities drain human capital and inflate operational costs without ever appearing in standard financial reports.
There's a direct correlation between process maturity and the predictability of business outcomes. Organizations with mapped, standardized workflows experience lower variance in quality and cycle times. Mapping ensures that efficiency isn't dependent on the heroics of individual staff members but is built into the organizational structure. This methodical clarity allows for a more accurate assessment of theoretical capacity versus actual output. It provides a realistic benchmark for organizational performance that spreadsheet tracking simply cannot replicate.
Assessing ICT Alignment and Technology ROI
A common barrier to efficiency is the "Integration Gap" between disparate software systems. When ICT solutions don't communicate, staff are forced into manual data entry, which creates new friction and increases error rates. To determine how to measure business efficiency in a digital environment, you must assess if your technology is solving problems or merely creating digital workarounds. If systemic friction persists despite high technology spend, it's often a sign that a digital transformation blueprint is required to realign your technical architecture with your strategic goals. This ensures that every dollar spent on technology delivers a measurable return in operational speed.
The Role of Automation in Process Optimisation
Automation implementation is a high-impact strategy, yet it fails when applied to flawed workflows. Mapping identifies high-volume, low-complexity tasks that are ripe for automation, ensuring that you don't simply accelerate an inefficient process. Once implemented, the primary metric for success is the "Hours Saved" metric. This is a concrete data point that reflects the reallocation of human effort from administrative drudgery toward higher-value strategic tasks. This transition from manual to automated execution is only possible when a prior process mapping engagement has cleared the path of unnecessary complexity, ensuring the automation drives genuine system harmony.
How to Conduct a Strategic Business Efficiency Audit
A strategic audit is the formal mechanism for determining how to measure business efficiency with precision. It moves beyond passive observation to provide a structured diagnostic of the entire organizational machine. This process follows five logical steps to ensure no operational friction remains hidden. By following a methodical sequence, leadership can transition from fragmented data to a unified strategic roadmap.
Step 1: Define the Audit Scope. Determine whether the assessment will target a specific department or the entire enterprise. Enterprise-wide audits are preferable for identifying cross-functional friction, while departmental audits allow for rapid, localized iteration.
Step 2: Gather Baseline Data. Collect quantitative metrics across the financial and operational tracks established earlier. This includes historical turnover rates, cycle times, and resource allocation data from the current fiscal year.
Step 3: Conduct Stakeholder Interviews. Quantitative data identifies what is happening, but stakeholder interviews reveal why. These discussions expose qualitative friction points and "shadow processes" that metrics alone cannot capture.
Step 4: Analyse the Gap. Compare your current metrics against 2026 industry benchmarks. For example, if your net profit margin falls significantly below the 7.71% industry average, the audit must pinpoint exactly where capital is being eroded.
Step 5: Develop a Prioritised Roadmap. Translate findings into a sequence of resolutions. This roadmap should align technical requirements with broader organizational objectives to ensure sustainable progress.
Establishing an Evidence-Based Baseline
You cannot improve what you have not accurately measured. Establishing an evidence-based baseline is the only way to validate the success of future interventions. Use objective data collection tools, such as automated workforce analytics and financial logging systems, to gather information without disrupting daily operations. Relying on subjective self-reporting often leads to skewed results and missed opportunities for optimization. Engaging an objective, third-party analysis during this phase ensures that internal biases don't mask systemic inefficiencies.
Prioritising Improvements for Maximum Impact
Attempting to fix every inefficiency simultaneously often leads to organizational fatigue and diluted results. Apply the Pareto Principle to identify the 20% of process bottlenecks causing 80% of your operational friction. Differentiate between "Quick Wins", which are low-cost adjustments with immediate returns, and long-term strategic transformations that require deeper investment. Executing these changes requires an expert project management plan to maintain momentum and ensure that every adjustment delivers tangible value.
If your organization is struggling to identify the starting point for these improvements, our Business Efficiency Diagnostic provides the specialized tools and expertise needed to uncover and resolve hidden friction points across your entire value chain.
Sustaining Efficiency with Strategic ICT Oversight
Sustaining peak performance requires a shift in organizational culture from reactive troubleshooting to continuous optimization. Efficiency measurement is not a one-time project; it's a cyclical process that must be integrated into the rhythm of the business. As market conditions and technology evolve, the friction points identified today will inevitably shift. Maintaining operational leanness requires high-level leadership that views how to measure business efficiency as a permanent strategic function rather than a periodic response to rising costs.
In many organizations, a disconnect exists between technical ICT departments and broader business objectives. This gap often leads to technology spend that doesn't deliver a measurable impact on productivity. Integrating Fractional CIO services provides the specialized expertise needed to bridge this divide. By providing high-level strategic oversight, these services ensure that every technical decision is grounded in a logical pursuit of organizational performance. This proactive approach allows leadership to identify and resolve systemic issues before they impact the bottom line.
Bridging the Gap Between Strategy and Execution
Execution fails when efficiency goals aren't reflected in daily project decisions. Every investment in software or hardware must be scrutinized for its ability to reduce cycle times or improve resource allocation. Using a digital transformation blueprint serves as a navigational guide for these long-term investments. It ensures that technical requirements remain aligned with strategic outcomes, preventing the accumulation of technical debt. Maintaining momentum after the initial diagnostic phase requires this level of disciplined adherence to a structured roadmap.
Next Steps: Requesting a Professional Diagnostic
Internal audits are valuable, but they often reach a limit when internal biases or a lack of specialized tools mask deeper inefficiencies. External expertise provides the objective clarity needed to uncover friction points that have become "invisible" to regular staff. A professional Business Efficiency Diagnostic offers a methodical evaluation of your entire value chain, using specialized diagnostic tools to provide a clear, evidence-based baseline of your current performance. This process moves beyond simple data gathering to provide a prioritized roadmap for resolution and growth.
Take the first step toward optimizing your organizational performance. Book a consultation with Business Analysis & Solutions to begin your diagnostic process and gain the clarity required to master how to measure business efficiency in 2026 and beyond.
Driving Sustainable Performance Through Strategic Clarity
Mastering how to measure business efficiency requires more than tracking isolated financial ratios; it demands a dual-track framework that synchronizes balance sheet data with the granular reality of daily operations. By utilizing process mapping to expose shadow processes and implementing a Digital Transformation Blueprint, leaders can ensure that technology investments drive measurable organizational performance rather than creating new layers of friction. This methodical approach transforms performance from a passive observation into an active strategic asset.
Business Analysis & Solutions provides the objective clarity needed to resolve complex operational challenges. With over 20 years of professional ICT and business analysis experience, we help organizations across Australia bridge the gap between technical requirements and strategic objectives. Our national service coverage ensures that your enterprise has access to the specialized diagnostic tools required to identify and resolve systemic bottlenecks. Request a Business Efficiency Diagnostic to identify your specific friction points and establish a prioritized roadmap for sustainable optimization today.
Frequently Asked Questions
How often should a business measure its operational efficiency?
Efficiency measurement should be integrated into a continuous operational cycle rather than treated as an annual event. High-level financial ratios are typically reviewed quarterly, while granular operational KPIs require monthly tracking to identify emerging friction points. Determining how to measure business efficiency effectively requires this steady cadence. It allows leadership to make data-driven adjustments before minor inefficiencies evolve into systemic failures, ensuring the organization remains agile and responsive to shifting market conditions.
What is the most important metric for business efficiency?
There is no single universal metric, but Revenue per Employee serves as a critical high-level indicator of human capital productivity. This figure reveals how effectively your organizational structure and technology stack empower your workforce to deliver value. While other ratios like inventory turnover are essential for specific sectors, Revenue per Employee provides a broad diagnostic signal. It highlights the core alignment between resource input and strategic output across almost any professional industry.
Can a small business benefit from a formal efficiency diagnostic?
Small businesses often gain the most significant advantages from a formal diagnostic because it prevents the scaling of inefficient "shadow processes." Identifying friction early ensures that growth is built upon a stable, optimized foundation rather than fragile workarounds. A structured assessment provides the clarity needed to prioritize limited resources. This ensures that every investment in technology or staff directly contributes to measurable organizational performance and long-term resilience against rising operational costs.
How do I know if my ICT strategy is hindering my efficiency?
The primary indicator of a hindering ICT strategy is a high technology spend coupled with stagnant or declining operational output. If staff are frequently utilizing manual workarounds to bypass official systems, your technology is likely creating friction rather than resolving it. A widening "Integration Gap" between disparate software tools further signals that your digital architecture is misaligned. This lack of system harmony often forces employees into redundant data entry tasks.
What is the difference between ROI and business efficiency?
ROI measures the financial return on a specific investment, while business efficiency evaluates the ratio of strategic output to the total resource input of time, capital, and effort. ROI tells you if an investment was profitable, but efficiency reveals if the process used to achieve that profit was optimal. Understanding how to measure business efficiency requires looking beyond the bottom line to evaluate the deep-layer operational health of the entire organizational system.
How does process mapping help in measuring efficiency?
Process mapping translates abstract data into a visual architecture, allowing leadership to identify redundant hand-offs and approval loops that standard metrics miss. It provides a baseline for measuring the variance between your theoretical capacity and actual output. By documenting every step of a workflow, you can pinpoint the exact location of operational friction. This makes it possible to measure the precise impact of specific process improvements on overall cycle times and resource allocation.
What role does automation play in long-term efficiency?
Automation serves as a catalyst for sustainable operational leanness by removing high-volume, low-complexity tasks from the human workload. This reduces error rates and significantly shortens cycle times, allowing staff to focus on high-value strategic initiatives. Long-term efficiency is achieved when automation is applied to already optimized processes. This ensures that the technology drives system harmony rather than just accelerating a fundamentally flawed or redundant workflow that drains resources.
What are the first signs that a business is becoming inefficient?
The earliest signs of inefficiency often manifest as rising operational costs that aren't accompanied by a proportional growth in output. Leadership might also notice an increase in rework due to high error rates or a general decline in employee engagement as staff struggle with cumbersome legacy processes. These indicators suggest that the "Efficiency Gap" is widening. They signal the need for a comprehensive diagnostic to identify the root causes of the friction before performance degrades further.



Comments