
The Executive Checklist for Effective Business Process Maps in 2026
Updated: Apr 22
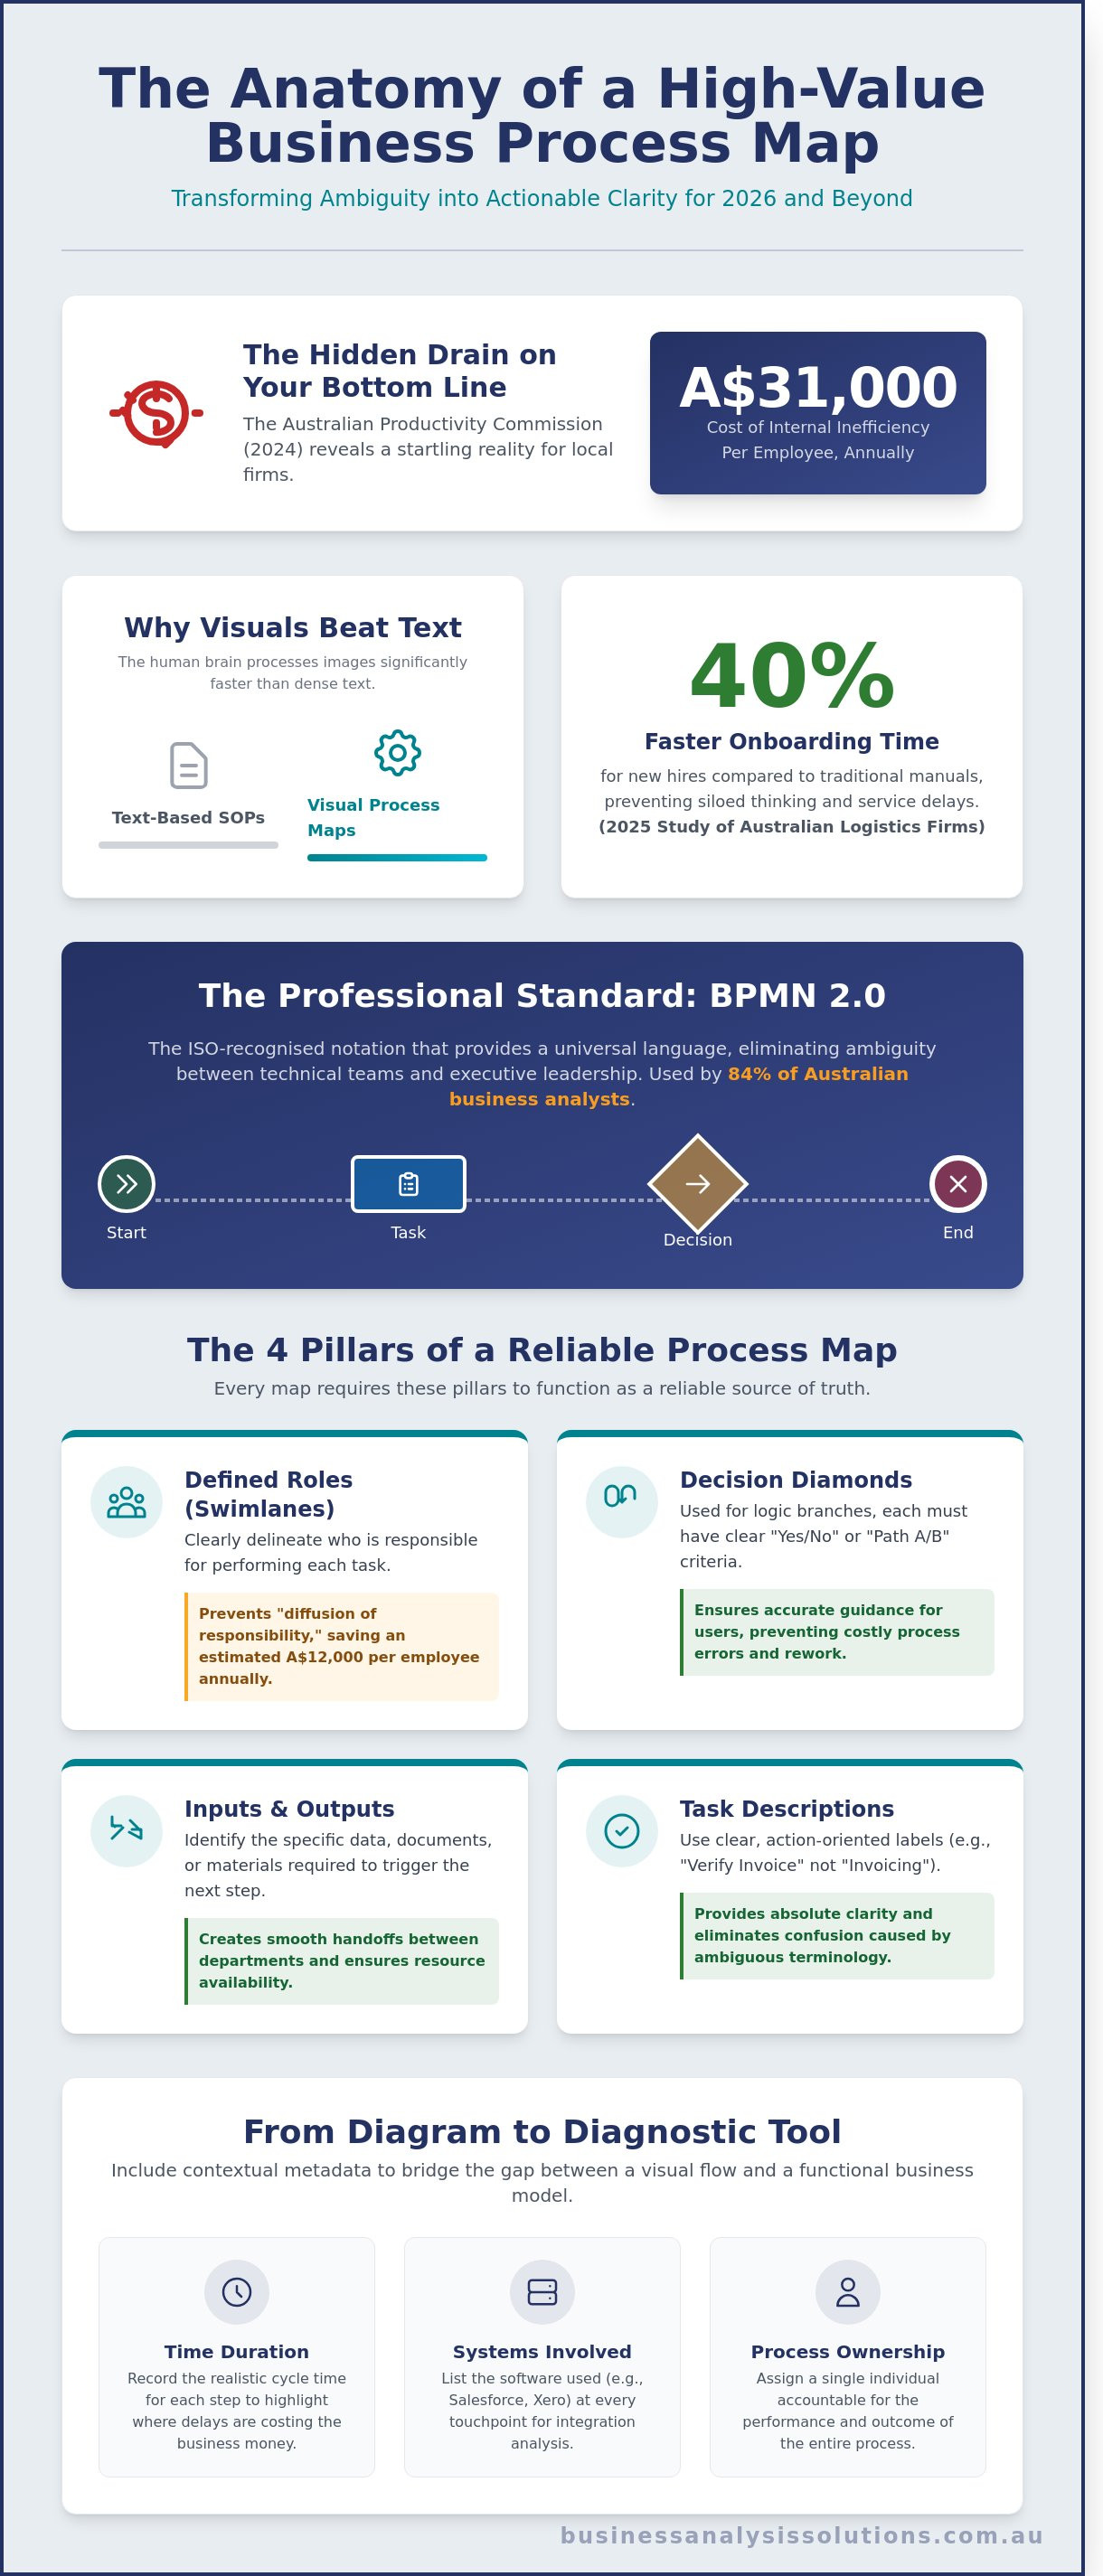
Recent data from the 2024 Australian Productivity Commission reveals that internal inefficiencies cost local firms approximately A$31,000 per employee annually. You've likely experienced the frustration of operational bottlenecks or inconsistent output quality that stems from a lack of clarity on roles and responsibilities. These aren't just minor friction points; they're significant drains on your bottom line that complicate everything from training new staff to scaling operations. Mastering the strategic application of business process maps is the most effective way to untangle these complexities and drive measurable organisational growth.
We agree that a business shouldn't operate in a state of perpetual ambiguity. This guide promises to provide the specific executive checklist you need to transform abstract workflows into precise visual representations of work. We'll preview the essential components for 2026, including how to identify high-value areas for automation and foster seamless cross-departmental communication. By following this structured approach, you'll bridge the gap between technical requirements and your high-level strategic objectives.
Key Takeaways
Distinguish between process visualisation and simulation to establish a precise foundation for organisational clarity.
Utilise standardised BPMN 2.0 notation to ensure your business process maps provide cross-industry clarity and professional-grade accuracy.
Leverage completed maps as diagnostic tools to identify the "Seven Wastes" and systematically eliminate operational inefficiencies.
Select the optimal mapping methodology—from high-level SIPOC to detailed activity maps—to align with your specific strategic objectives.
Bridge the gap between static diagrams and execution by using stakeholder engagement to drive measurable organisational growth.
Table of Contents The Fundamentals of Business Process Maps for Organisational Clarity The Comprehensive Checklist: Essential Components of a Professional Process Map Analysing Process Maps to Identify Operational Inefficiencies Selecting the Right Mapping Methodology for Your Business Objectives From Mapping to Execution: Implementing Strategic Process Improvements
The Fundamentals of Business Process Maps for Organisational Clarity
Business process maps serve as the visual architecture of an organisation, detailing work sequences and decision points with surgical precision. While mapping focuses on the static visualisation of current or future states, process modelling introduces dynamic simulation to predict how specific changes affect performance. Establishing these maps is the non-negotiable first step in any Business Efficiency Diagnostic. Without a clear map, diagnostic efforts lack the baseline data required to identify bottlenecks or quantify redundancies accurately.
Moving away from "tribal knowledge" is a primary driver for executive investment in 2026. Research indicates that Australian mid-market firms lose up to 25% of their operational intelligence when key personnel depart without documented processes. By codifying these workflows, companies transform individual expertise into permanent institutional assets. This transition ensures that operational logic remains within the firm, regardless of staff turnover, protecting the company's long-term value.
Once these workflows are codified, firms are better positioned to scale their workforce without losing operational quality. For example, many organizations leverage WorkStaff360 to provide dedicated remote professionals who can step into these documented roles and maintain high standards of delivery.
Why Visual Documentation Beats Text-Based SOPs
Visual flowcharts outperform dense manuals because the human brain processes imagery significantly faster than text. A 2025 study of Australian logistics firms found that visual business process maps reduced onboarding time for new hires by 40% compared to traditional text-based Standard Operating Procedures (SOPs). Maps expose cross-functional dependencies that are often buried in long paragraphs. They make it clear where one department's output becomes another's input, which prevents the siloed thinking that typically leads to service delivery delays.
The Strategic Objectives of Mapping
Strategic mapping isn't just about drawing boxes; it's about establishing a single source of truth for all stakeholders. Objectives typically fall into three categories: transparency, regulatory compliance, or performance optimisation. For organisations governed by Australian standards like ISO 9001, business process maps provide the necessary evidence for quality assurance audits. It acts as a risk mitigation tool, identifying high-risk decision points where errors could lead to financial or reputational damage. By 2026, 90% of high-performing Australian enterprises will use these maps to align technical requirements with overarching business goals, a strategic focus also emphasized by Bin Hamad Mathew Joseph and Associates Chartered Accountants in their tips for future success.
The Comprehensive Checklist: Essential Components of a Professional Process Map
A professional diagram isn't just a drawing; it's a technical blueprint for operational success. To ensure business process maps deliver actual value in 2026, they must adhere to the ISO-recognised BPMN 2.0 standard. This notation provides a universal language that 84% of Australian business analysts use to eliminate ambiguity between technical teams and executive leadership. Every map must begin with a clear "Start" trigger, such as a customer enquiry, and conclude with a definitive "End" state, like a delivered service. Without these boundaries, scope creep is inevitable.
Core Elements Every Map Requires
Precision is the foundation of any useful process diagram. Ambiguity in a flowchart leads to errors on the floor. Every map requires these four pillars to function as a reliable source of truth:
Defined Roles (Swimlanes): Clearly delineate who performs each task. This prevents the "diffusion of responsibility" that costs Australian firms an estimated A$12,000 per employee annually in lost productivity.
Decision Diamonds: Use these for logic branches. Each diamond must have clear "Yes/No" or "Path A/Path B" criteria to guide the user accurately.
Inputs and Outputs: Identify the specific data, documents, or materials required to trigger the next step.
Task Descriptions: Use action-oriented labels. "Verify Invoice" provides clarity; "Invoicing" creates confusion.
Contextual Metadata for High-Value Maps
High-performing business process maps include metadata that bridges the gap between a visual flow and a functional business model. This data allows for precise bottleneck identification and capacity planning. If you're looking to refine these details, you can optimise your operational workflows with a structured audit. Focus on these three metadata points:
Time Duration: Record the realistic cycle time for each step. This highlights where delays are costing the business money.
Systems Involved: List the software used, such as Xero, Salesforce, or custom ERPs, at every touchpoint.
Ownership: Assign a single process owner accountable for the outcome. Shared ownership often results in no ownership.
Before finalising any draft, validate the accuracy with your frontline team using a structured review. Walk through the process backwards to catch missing steps. Confirm every decision diamond has a defined exit for every possible scenario. Finally, ensure the map matches the current reality of the work, not just the "ideal" version described in outdated manuals. Accuracy in the draft phase prevents expensive rework during implementation.
Analysing Process Maps to Identify Operational Inefficiencies
A completed business process map serves as a diagnostic instrument rather than a mere visual aid. It reveals the friction between the perceived "ideal" workflow and the reality of daily operations. By scrutinising these maps, executives can identify the Seven Wastes of lean management: overproduction, waiting, transport, inappropriate processing, unnecessary inventory, unnecessary motion, and defects. In a typical Australian professional services firm, these wastes often manifest as idle time between handovers or redundant data entry across disconnected platforms.
Business process maps also expose the prevalence of "Shadow IT." This occurs when staff implement undocumented workarounds, such as using personal spreadsheets to bypass rigid, legacy ERP systems. These workarounds create significant security risks and data silos. Additionally, analysts must look for "Single Points of Failure." These are nodes in the workflow where a specific individual or a single piece of software holds exclusive control. If that person is absent or the system fails, the entire downstream operation halts. A 2024 study of mid-market Australian enterprises found that 18% of critical delays were caused by these unmitigated dependencies.
Spotting Bottlenecks and Redundancies
Effective analysis requires a focus on three structural flaws. First, identify "pile-ups" where multiple inputs wait for a single approval, creating a queue that stalls progress. Second, look for "loops" where work is frequently sent back for correction due to poor initial requirements. Finally, highlight "dead ends" where data is collected and stored but never utilised for decision-making. These data graveyards consume storage costs without delivering any measurable return on investment.
Measuring the Cost of Inefficiency
To calculate the annual labour cost of a redundant step, multiply the employee's hourly rate by the time spent on the task and its yearly frequency. This figure often feeds into the "hidden factory," which represents the invisible work staff perform to fix errors from previous steps. This unrecorded effort can consume up to 25% of a department's total capacity. Identifying these costs provides the logical foundation for a formal Digital Transformation Blueprint to modernise the organisation.
Selecting the Right Mapping Methodology for Your Business Objectives
Selecting an inappropriate methodology creates friction and obscures the very insights you need to capture. Executives must distinguish between high-level SIPOC (Supplier, Input, Process, Output, Customer) diagrams and granular activity maps. A SIPOC diagram acts as a strategic lens, defining boundaries for a project without getting bogged down in task-level detail. This is your starting point for 2026 strategic planning. Conversely, detailed activity maps are essential when you need to document specific work instructions or compliance requirements. Use Value Stream Mapping (VSM) specifically when your objective is to identify Lean waste and reduce lead times. Standard flowcharts remain the preferred choice for simple logic and sequence documentation.
Every successful transformation requires a rigorous "As-Is" phase before moving to a "To-Be" state. Skipping the "As-Is" map is a critical error that prevents accurate ROI calculation. Research from 2024 indicates that Australian firms lose an average of A$18,400 per employee annually due to process inefficiencies. By documenting the current state, you establish a baseline to measure the A$ value of your future state improvements. These business process maps provide the logical bridge between current operational pain and strategic resolution.
Top-Down vs. Cross-Functional Mapping
Top-Down maps provide a 30,000-foot view tailored for the C-suite. They focus on the value chain and ignore minor exceptions to maintain clarity. Operational teams require Cross-Functional (Swimlane) maps. These diagrams clarify departmental hand-offs, which is where 65% of process delays occur. For ICT-heavy environments, Data Flow Diagrams (DFD) are non-negotiable. They map how information moves between legacy systems and new cloud architectures, ensuring technical requirements align with business needs.
Mapping for Automation Readiness
Effective business process maps are the primary tool for identifying "low-hanging fruit" for Robotic Process Automation (RPA). A process is only automation-ready if it's stable, repetitive, and digital. If a process requires frequent human judgement or handles physical paperwork, it's not a candidate for RPA. You should never automate a broken process; doing so merely produces errors faster. In the Australian market, automating an unoptimized process can lead to a 40% increase in technical debt within the first twelve months.
Ready to define your operational future? Book a professional process mapping consultation to ensure your methodology matches your goals.
From Mapping to Execution: Implementing Strategic Process Improvements
A business process map is only as valuable as the change it facilitates. Transitioning from a static diagram to an active improvement project requires moving beyond documentation into disciplined execution. This shift depends entirely on stakeholder engagement. If the frontline staff who use these processes daily aren't involved in the design, the map becomes a theoretical artifact rather than a functional tool. High levels of adoption occur when teams see their feedback reflected in the final workflow.
Strategic alignment is the primary goal of this execution phase. A Fractional CIO uses business process maps to audit technical infrastructure against commercial objectives. This ensures that every A$10,000 invested in software or automation directly supports a documented business requirement. It prevents the common Australian corporate trap of "tech for tech's sake," where expensive platforms are purchased but never fully integrated into the actual way people work.
To move from vision to reality, follow this 30-60-90 day execution plan:
Day 30: Finalise the "To-Be" map and secure 100% sign-off from department heads. Identify the specific KPIs that the new process will impact.
Day 60: Launch a pilot program in one department. Monitor for bottlenecks and adjust the business process maps based on real-world performance data.
Day 90: Execute the full-scale rollout across the organisation and begin the first formal post-implementation review to calculate ROI.
The Governance of Process Maps
Process maps aren't "set and forget" assets. They require a quarterly review cycle to remain relevant, or an immediate update following any technology acquisition exceeding A$50,000. Establishing a central "Process Repository" ensures every employee accesses the same version of the truth. This governance structure supports a Kaizen culture, where small, logical improvements are identified and implemented continuously rather than waiting for a major crisis to force change.
Leveraging Expert Business Analysis
Internal teams often suffer from operational blindness; they're too close to the work to see the "invisible" flaws in their own routines. An external perspective is vital for identifying these inefficiencies, which can cost Australian firms up to 15% in lost productivity annually. Professional Project Management provides the structured oversight needed to ensure these process changes are delivered on time and within budget. Don't let your strategy stall at the mapping stage. Book a diagnostic with our team today to turn your maps into measurable results.
Advancing Your Operational Architecture for 2026
Precision in your business process maps is the primary differentiator for Australian firms targeting peak performance in the coming year. This checklist ensures your organisational clarity isn't just a goal but a measurable reality. By identifying the 18% of operational inefficiencies often hidden in manual workflows, you can redirect resources toward high-value strategic initiatives. It's about moving beyond static diagrams to create dynamic frameworks that bridge the gap between complex technical requirements and core business objectives.
Business Analysis & Solutions brings over 20 years of industry experience to help you navigate these transitions. We've developed a proven track record for delivering actionable Digital Transformation Blueprints that translate strategy into tangible results. Don't let process ambiguity stall your progress when a structured, methodical approach can unlock your firm's full potential. Our expertise ensures your mapping efforts lead directly to seamless integration and a high return on investment.
Your path to a more streamlined and profitable enterprise starts with a single, well-executed map.
Frequently Asked Questions
What is the difference between a process map and a flowchart?
A process map provides a high-level strategic overview of inputs, outputs, and roles, whereas a flowchart focuses on the sequential steps of a specific task. While flowcharts visualize simple logic, business process maps document the broader ecosystem including performance metrics and functional ownership. This distinction ensures that executives see the entire value chain. It prevents the common mistake of viewing operations as isolated, disconnected actions.
How long does it typically take to map a core business process?
Mapping a core business process typically requires 15 to 25 hours of active stakeholder engagement over a 3-week period. This timeline accounts for initial discovery sessions, draft creation, and two rounds of executive validation. Complex cross-functional workflows involving more than 5 departments often extend this duration by 12 hours. This extra time ensures all critical hand-off points between teams are accurately captured and verified.
Which software is best for creating professional business process maps?
Microsoft Visio remains the standard for technical precision, though Lucidchart is the preferred choice for real-time collaboration across distributed Australian teams. For organisations requiring BPMN 2.0 compliance, Signavio provides enterprise-grade analytical capabilities. Costs for these tools range from A$20 to A$85 per user per month. Selecting the right platform depends on the depth of reporting required for your business process maps.
Do I need a consultant to create our business process maps?
You don't strictly need a consultant, but internal teams often lack the objectivity required to identify systemic bottlenecks. Data from 2024 indicates that 65% of internal mapping projects fail to move past the documentation phase due to internal bias. Engaging a specialist provides a structured framework. It ensures the final maps align with strategic objectives rather than just documenting existing, inefficient habits that your staff may have developed.
What are the most common mistakes in business process mapping?
The most frequent error is mapping the process as people wish it worked rather than how it currently operates. This invalidates your baseline data. Other mistakes include failing to define clear start and end boundaries and ignoring "shadow IT" steps used to bypass broken systems. In 2025, 42% of process failures were traced back to maps that lacked clear ownership for specific decision nodes and outcomes.
How do business process maps help with ISO 9001 compliance?
Business process maps satisfy the ISO 9001:2015 requirement for documented information regarding the "operation of processes." They provide auditors with clear evidence that your organisation understands its sequence and interaction of activities. By defining clear quality checkpoints and performance indicators, these maps reduce the risk of non-conformance. This structured approach helps maintain compliance during your annual surveillance audit, which typically costs A$3,000 to A$5,000.
Can business process maps be used to identify automation opportunities?
Yes, business process maps are the primary tool for identifying high-volume, repetitive tasks suitable for Robotic Process Automation (RPA). By visualising the workflow, you can isolate decision points that follow logical rules rather than human judgement. Companies using detailed maps typically identify 3 to 5 immediate automation opportunities. These targeted interventions can reduce operational costs by 18% within the first 12 months of implementation.
What is the difference between "As-Is" and "To-Be" process mapping?
"As-Is" mapping documents the current state of your operations, while "To-Be" mapping designs the optimised future state. You can't effectively design the "To-Be" model without a factual "As-Is" foundation to identify existing friction points. This two-step approach ensures that any proposed changes are grounded in reality. It allows you to address the root causes of current performance gaps rather than just treating the visible symptoms.



Comments