Signs of an Inefficient Business: Identifying and Rectifying Operational Friction in 2026
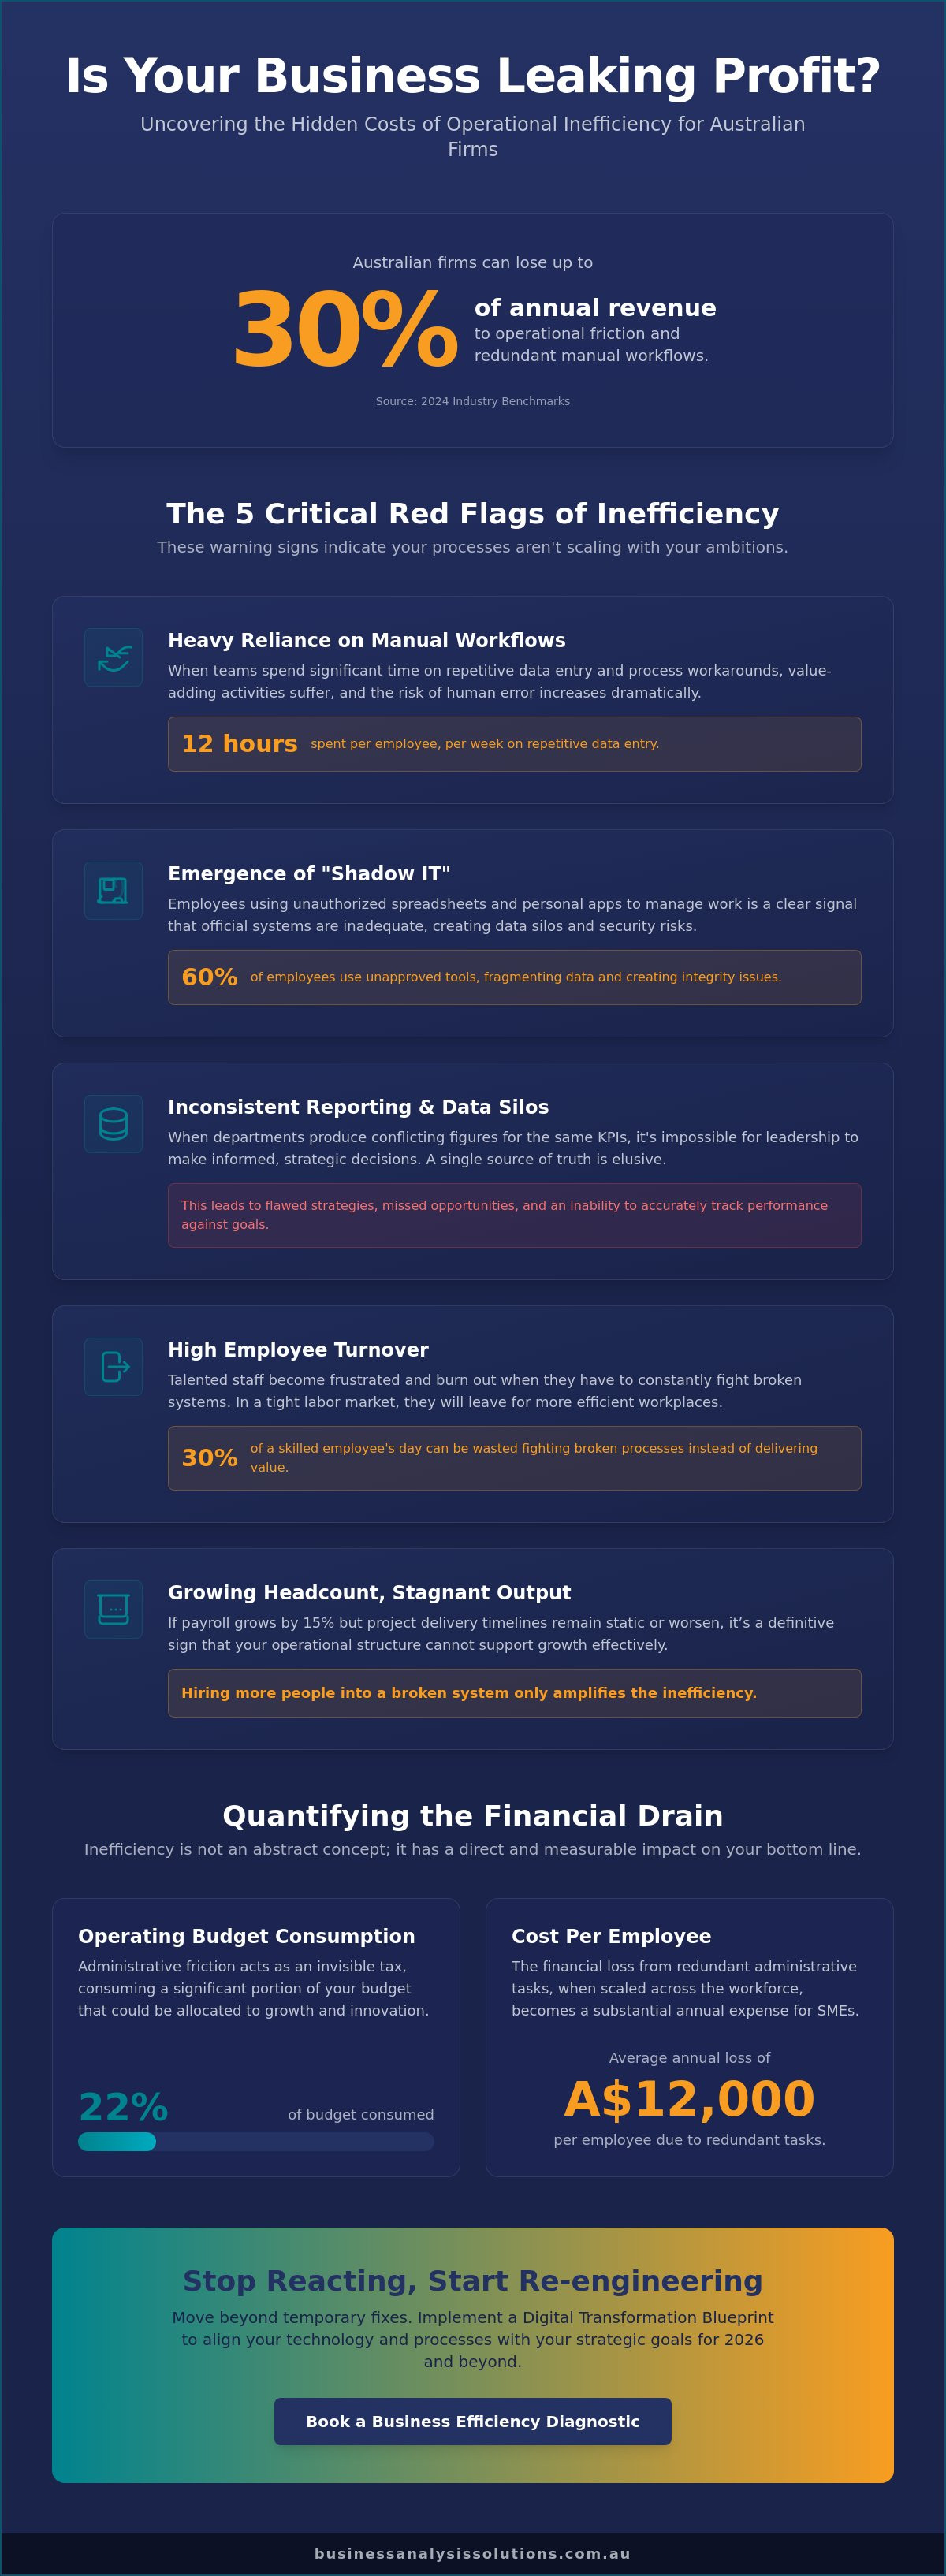
Scaling your headcount by 15% shouldn't result in a net zero increase in total output. If your payroll grows while your project delivery timelines remain static, you're likely ignoring the critical signs of an inefficient business. Recent 2024 industry benchmarks indicate that Australian firms lose up to 30% of their annual revenue to operational friction and redundant manual workflows. These hidden costs often stem from legacy systems that no longer support your current scale, creating a gap between your technical capabilities and your strategic objectives.
You likely feel the weight of this friction when you can't access real-time data or when your team spends 12 hours a week on repetitive data entry. It's frustrating to watch profit margins erode while your ICT infrastructure fails to keep pace with your growth targets. This article provides a methodical framework to identify structural misalignments and restore operational excellence. You'll gain a clear checklist for immediate fixes and a strategic roadmap for digital transformation to ensure your organisation remains competitive and profitable through 2026.
Key Takeaways
Distinguish between superficial "busy-ness" and genuine productivity by measuring the performance delta within your current corporate structure.
Identify the primary signs of an inefficient business, including a reliance on manual data entry and the emergence of unauthorised "Shadow IT" spreadsheets.
Evaluate the hidden costs of friction, from inflated Customer Acquisition Costs (CAC) to the significant drain on executive bandwidth.
Apply a methodical assessment framework to audit core functions and engage stakeholders in identifying operational bottlenecks.
Move beyond temporary fixes by implementing a Digital Transformation Blueprint that aligns IT investments with your long-term strategic goals.
Table of Contents Identifying the Structural Signs of an Inefficient Business The 5 Critical Red Flags: From Manual Workflows to Data Silos Quantifying the Impact: How Inefficiency Stalls Growth The Business Efficiency Diagnostic: A Framework for Assessment Strategic Rectification: Implementing a Digital Transformation Blueprint
Identifying the Structural Signs of an Inefficient Business
Operational inefficiency represents the measurable delta between an organisation's theoretical output and its actual performance. In the 2026 Australian corporate environment, this gap often hides behind a facade of "busy-ness." Teams might log 50-hour weeks, yet if those hours focus on manual data entry or rectifying preventable errors, productivity remains stagnant. Identifying the signs of an inefficient business requires looking past activity levels to evaluate actual value creation. When internal friction becomes the norm, leadership confidence wavers and stakeholder trust begins to decline. This psychological toll is often as damaging as the financial loss, creating a culture of reactive firefighting rather than proactive growth.
The 2026 market dynamics penalise internal friction more heavily than previous years. With Australian labor costs rising following the Fair Work Commission's cumulative wage increases in 2024 and 2025, every minute wasted on redundant tasks carries a higher price tag. Friction isn't just an internal annoyance; it's a direct threat to survival in a high-interest rate environment where capital efficiency is paramount. Leaders must recognize that a workforce that appears constantly overwhelmed is rarely a sign of success. Instead, it's often a clear indicator that processes aren't scaling alongside the company's ambitions.
The High Cost of the Status Quo
Redundant processes act as an invisible tax on the bottom line. Recent Australian productivity data suggests that administrative friction can consume up to 22% of an enterprise's operating budget. These costs don't appear as a single line item but manifest as missed deadlines, high staff turnover, and bloated overheads. Business inefficiency is a failure of strategic alignment. When internal workflows don't mirror high-level objectives, competitive advantage erodes rapidly. Firms that ignore these structural flaws find themselves outpaced by leaner competitors who have prioritised operational clarity. In the local market, where consumer expectations for speed and precision are at an all-time high, the cost of maintaining the status quo is often total irrelevance.
Symptoms vs. Root Causes
Leaders often mistake cash flow volatility for a sales problem. While low revenue is a concern, it's frequently a symptom of process failure rather than market demand. Systemic bottlenecks, such as delayed approval loops or fragmented software stacks, stifle growth more effectively than any competitor could. Addressing these issues often requires Business process re-engineering to fundamentally overhaul how value is delivered. It's vital to distinguish between a low-performing individual and a broken system. Identifying the signs of an inefficient business allows a firm to move beyond blaming staff and toward fixing the architecture of the work itself. True business efficiency isn't about working harder; it's about the logical integration of resources to ensure long-term sustainability and predictable outcomes.
The 5 Critical Red Flags: From Manual Workflows to Data Silos
Operational friction often manifests as subtle delays before escalating into systemic failure. One of the most visible signs of an inefficient business is a heavy reliance on manual data entry and "Shadow IT." When employees resort to unauthorised spreadsheets to bypass official systems, it signals that your core infrastructure is failing to meet user needs. A 2023 industry study indicated that 60% of employees use personal apps or unapproved tools to manage their workloads, creating significant security risks and data integrity issues. This fragmentation ensures that a single version of the truth remains elusive.
Inconsistent reporting is another diagnostic marker of decay. When different departments produce conflicting figures for the same KPIs, leadership cannot make informed decisions. This friction directly correlates with high employee turnover. When talented staff spend 30% of their day fighting broken processes rather than delivering value, burnout becomes inevitable. Australia's tight labour market in 2026 means firms can't afford to lose expertise to avoidable process frustration. The financial impact is measurable; recent analysis suggests Australian SMEs lose an average of A$12,000 per employee annually due to redundant administrative tasks.
Data Fragmentation and ICT Misalignment
Siloed information prevents a single source of truth, making strategic decision-making nearly impossible. Many Australian organisations find that their current ICT solutions no longer support their scale. Adding more software often compounds the problem. If your tech stack doesn't integrate seamlessly, you're merely digitising existing inefficiencies. True efficiency requires a technical architecture that mirrors your actual business objectives rather than forcing staff to adapt to rigid, outdated systems.
Process Redundancy and Workflow Friction
Redundancy thrives in the absence of regular audits. Tasks are often performed simply because they're part of a legacy routine, regardless of their current utility. The "Approval Bottleneck" is a prime example; bureaucratic lag can stall project momentum for weeks. Expert business process mapping exposes these hidden redundancies by visualising every touchpoint and hand-off within a workflow. By identifying and streamlining processes, leaders can bridge the widening gap between technical requirements and business goals. If your operations feel disjointed, a structured operational audit can provide the necessary clarity to move forward and regain your competitive edge.
Quantifying the Impact: How Inefficiency Stalls Growth
Operational friction manifests directly in financial metrics. When internal handovers fail, Customer Acquisition Cost (CAC) rises. In 2025, Australian firms with high friction saw a 15% increase in acquisition costs due to sales-to-service gaps. Lifetime Value (LTV) simultaneously erodes as customers encounter inconsistent delivery. These are clear signs of an inefficient business. For eCommerce operators, partnering with Pik Pak Logistics can mitigate these risks by professionalizing the fulfillment and returns process to reduce delivery friction. Executive leadership feels this most acutely; current data suggests leaders spend 40% of their time firefighting operational glitches. This creates a massive opportunity cost. Projects that could drive a 20% revenue increase stay on the shelf because the core engine is too messy to support new load. Instead of scaling, staff develop a culture of workarounds, using manual spreadsheets to patch systemic holes. This habit prevents the business from ever reaching a state of repeatable, automated success.
The Financial Erosion Factor
ICT projects often become money pits without rigorous oversight. Direct costs include wasted A$50,000 licensing fees for unused modules, but indirect costs are higher. Poor requirements elicitation causes 70% of software implementation failures. When stakeholders don't define precise needs, the resulting system fails to deliver the expected ROI. Process clarity is the only reliable predictor of project success. Without it, your technology spend is a gamble rather than an investment. We see this daily in organisations that prioritise speed over structural logic, leading to expensive technical debt that takes years to clear.
Strategic Stagnation
Market shifts in 2026 require rapid pivots. Inefficient businesses can't move because their data is siloed and their processes are rigid. Strategic agility depends on expert project management to bridge the gap between technical infrastructure and business goals. Without this bridge, even a fractional CIO cannot provide effective leadership. They lack the visibility needed to make high-stakes decisions. These signs of an inefficient business often mean you're the last to adapt to regulatory changes or competitor moves. Clarity is the prerequisite for speed; without it, your organisation remains reactive rather than proactive.
Executive Bandwidth: 40% of time lost to non-strategic tasks.
Software Failures: 70% linked to poor requirements elicitation.
Growth Ceiling: Workarounds prevent systems from handling 2x or 3x volume.
The Business Efficiency Diagnostic: A Framework for Assessment
Identifying the signs of an inefficient business requires more than a cursory glance at the quarterly balance sheet. It demands a structured diagnostic framework that moves beyond symptoms to uncover root causes. Our methodology begins with a high-level audit of core business functions. We measure output against resource consumption to determine where the ratio of effort to results has skewed. This isn't a theoretical exercise; it's a pragmatic evaluation of operational health.
Stakeholder engagement is the cornerstone of this diagnostic phase. We conduct structured interviews and workshops to identify "pain points" that frustrate staff and slow down delivery. By mapping the current state against professional standards, such as those defined by the International Institute of Business Analysis (IIBA), we create a gap analysis. This allows us to move from an identified challenge to a strategic outcome with precision. We then prioritise interventions using an impact-versus-complexity matrix. This ensures that resources are directed toward changes that deliver the highest return on investment first.
Step 1: Process Inventory and Mapping
We document every touchpoint in your primary service delivery chain. In a typical Australian professional services firm, a single client onboarding sequence can involve 12 distinct steps across three separate departments. We use process mapping to visualise exactly where bottlenecks and hand-off errors occur. This visual clarity exposes "dead-end" processes. These are legacy tasks that consume staff hours but provide zero value to the end client. Removing these redundancies can reduce operational overheads by as much as 18% in the first year of implementation.
Step 2: Technology and Data Audit
Your systems should facilitate growth, not restrict it. We evaluate if your business technology stack is fully integrated or operating in isolated silos. When data is trapped in disconnected platforms, management reporting becomes inaccurate and delayed. We assess the accessibility of your data and determine where automation can replace manual, repetitive tasks. Data from 2024 suggests that Australian businesses that automated 25% of their administrative workflows saw a 40% reduction in processing errors. We look for these specific opportunities to drive seamless integration across your entire digital infrastructure.
Operational friction is a silent profit killer. If you're ready to untangle your organizational complexities, contact Business Analysis Solutions for a professional consultation.
Strategic Rectification: Implementing a Digital Transformation Blueprint
Identifying the signs of an inefficient business is a necessary diagnostic exercise, but rectification requires a surgical, strategic approach. Most Australian organisations fall into the trap of "patching holes" with isolated software subscriptions or temporary staff hires. This reactive cycle often costs firms more in integration debt and lost productivity than the original problem was worth. Moving beyond these quick fixes requires a comprehensive strategic overhaul that replaces fragmented workflows with integrated systems.
A central component of this shift is the Digital Transformation Blueprint. This framework ensures your technology stack isn't just a collection of tools, but a cohesive engine that drives specific business objectives. For many mid-market Australian companies, hiring a full-time Chief Information Officer is a prohibitive expense. Fractional CIO services bridge this gap. They provide high-level strategic direction and executive oversight without the A$250,000 plus salary commitment. This allows for methodical analysis and the establishment of a culture focused on continuous improvement.
Bridging the Gap Between IT and Business
Technical requirements should never dictate your business strategy. Instead, every automation or ICT project must stem from a clear business objective. This concept of Strategic Alignment ensures technology serves the user and the bottom line, rather than creating new layers of complexity. Professional business analysis eliminates the ambiguity that leads to scope creep and budget overruns. By clearly defining process maps and stakeholder requirements before implementation, organisations can reduce the risk of project failure by up to 60%. This methodical approach ensures every dollar spent on digitisation contributes directly to a competitive advantage.
Securing the Future of Your Organisation
Efficiency isn't a one-time project; it's a persistent state of operational excellence. Measuring the success of these initiatives requires clear KPIs, such as a 25% reduction in manual data entry hours or a 15% increase in order processing speed. A documented, scalable operational framework allows your business to grow without the chaos that usually accompanies expansion. When processes are transparent and repeatable, the signs of an inefficient business disappear, replaced by a robust architecture that supports long-term profitability.
For owners in the AEC industry, this operational maturity is the first step toward a successful transition or sale; you can discover Significant Business Results to explore how specialized leadership coaching and exit strategies build on this foundation.
Book a Business Efficiency Diagnostic with our expert consultants today.
Transforming Operational Friction into Strategic Advantage
Operational drag often hides within manual workflows and isolated data silos that prevent real-time decision-making. By 2026, the cost of these bottlenecks will only increase as Australian market competition intensifies. Recognizing the signs of an inefficient business allows leaders to transition from reactive troubleshooting to proactive growth. This shift requires a methodical approach to process mapping and a commitment to bridging the gap between technical requirements and core business objectives.
Business Analysis Solutions brings over 20 years of industry experience to every engagement. We focus on delivering tangible ROI and ensuring that every digital integration is seamless. Our framework prioritizes clarity and precision; we help you untangle organizational complexities so your team can focus on high-value output. It's time to replace ambiguity with a structured blueprint for performance that aligns with international standards while respecting the direct nature of the Australian professional landscape.
Your path to a more streamlined and profitable future starts with a single, logical assessment. We look forward to helping you build a more resilient organization.
Frequently Asked Questions
What are the most common signs of an inefficient business?
The primary signs of an inefficient business include stagnant revenue growth despite high activity levels and a staff turnover rate exceeding the 12.5 percent Australian national average. You'll also notice that project delivery timelines consistently slip by 20 percent or more beyond original estimates. These indicators suggest that operational friction is eroding your profit margins and preventing your team from focusing on high-value strategic tasks.
How can I measure the cost of inefficiency in my company?
You calculate the cost of inefficiency by quantifying hidden waste, such as the 20 to 30 percent of annual revenue that industry analysts estimate companies lose to process gaps. Start by measuring the total cost of ownership for redundant manual tasks. Multiply the hours spent on rework by your average hourly labour rate in A$ to determine the immediate financial impact on your bottom line.
Does business automation always improve efficiency?
Automation doesn't always improve efficiency; it often accelerates existing flaws if applied to broken processes. A 2023 McKinsey report indicates that 70 percent of digital transformations fail to meet their objectives due to poor process design. You must first streamline the underlying workflow before implementing technology. Automating a redundant step simply creates digital waste at a higher velocity and increases technical debt.
What is the difference between a business audit and an efficiency diagnostic?
A business audit focuses on historical compliance and financial accuracy, while an efficiency diagnostic identifies forward-looking opportunities for operational improvement. The diagnostic uses 5 key performance indicators to pinpoint where friction occurs in your daily workflows. While the audit ensures you're meeting Australian regulatory standards, the diagnostic provides a roadmap for increasing your output without increasing your overhead costs.
How do data silos contribute to operational friction?
Data silos create operational friction by forcing employees to spend up to 1.8 hours every day searching for and gathering information. This fragmentation leads to duplicate data entry and a 25 percent increase in reporting errors across different departments. When your systems don't communicate, your leadership team makes decisions based on incomplete or conflicting datasets, which stalls strategic progress and increases enterprise risk.
Why is process mapping essential for identifying business waste?
Process mapping is essential because it provides a visual baseline of your current operations, revealing the 8 types of Lean waste often hidden in plain sight. By documenting every touchpoint, you can identify bottlenecks where tasks sit idle for more than 48 hours. This methodical approach allows you to strip away non-value-added activities and realign your resources with your core business objectives.
How long does it take to see results from an efficiency overhaul?
Most organisations see initial quick win improvements within 90 days of implementing process changes. A full-scale efficiency overhaul typically requires 6 to 12 months to achieve a total return on investment. This timeline allows for the stabilisation of new workflows and the collection of enough data to verify that the changes have permanently reduced your operational costs and addressed the signs of an inefficient business.
Can a small business benefit from fractional CIO services?
Small businesses benefit from fractional CIO services by gaining access to executive-level strategic guidance without the A$200,000 plus annual salary of a full-time hire. This model provides the technical leadership needed to integrate systems and eliminate operational friction. It's a pragmatic solution for firms that require high-level architecture and digital strategy to scale effectively in the competitive Australian market.



Comments