Process Mapping for Operational Efficiency: A Strategic Executive Guide
Most technology investments fail not because the software is flawed, but because it's layered on top of a broken, undocumented process. You likely understand the frustration of seeing manual redundancies slow down growth while opaque workflows leave leadership guessing where the true bottlenecks lie. It's difficult to scale an organization when the underlying mechanics are invisible or inconsistent. Implementing process mapping for operational efficiency transforms these hidden liabilities into a clear, strategic diagnostic that identifies exactly where profit is leaking.
As we approach the release of the ISO 9001:2026 standard in September, the focus on integrating quality culture and ethical workflows has never been more critical. You need more than a static diagram; you require a blueprint for digital transformation. This guide provides a methodical approach to identifying inefficiencies and preparing your operations for hyperautomation. We'll examine how to bridge the gap between technical requirements and organizational objectives to ensure your next strategic move delivers a tangible return on investment and a scalable foundation for the future.
Key Takeaways
Shift from simple process documentation to a strategic diagnostic that prioritizes value stream analysis and organizational coordination.
Apply a structured five-step framework for process mapping for operational efficiency to gain clear visibility into your current "as-is" state.
Identify and eliminate the "silent killers" of performance, specifically redundant manual tasks and the information silos that cause operational lag.
Establish a reliable foundation for automation by optimizing workflows before layering on ICT solutions to ensure a high return on investment.
Bridge the gap between visualization and execution by utilizing expert project management to drive adoption and deliver measurable operational excellence.
Table of Contents
What is Process Mapping for Operational Efficiency?
Process mapping for operational efficiency is a rigorous visual diagnostic designed to expose the underlying logic of organizational coordination. It's far more than a collection of shapes on a screen. Instead, it serves as a functional blueprint that identifies how value is created, where it's delayed, and how resources are consumed across a value stream. In 2026, the global Business Process Modeling market is projected to reach $5.5 billion, reflecting a shift where executives no longer view mapping as a passive documentation task. It has become a strategic necessity for high-level business technology adoption.
Modern Business process mapping prioritizes the analysis of end-to-end value streams over isolated departmental tasks. While traditional methods focused on "drawing boxes" to describe what people do, 2026 standards require a deeper look at data handovers and decision logic. This is particularly relevant as organizations prepare for the ISO 9001:2026 revision, which emphasizes a strong quality culture and ethical workflow integration. Static documentation is no longer sufficient; you need dynamic blueprints that serve as the foundation for automation and scalable growth.
The Core Objectives of Strategic Mapping
Strategic mapping aims to eliminate the ambiguity that often plagues cross-departmental handovers. When responsibilities aren't clearly defined, operational lag becomes inevitable. A professional map establishes a "single source of truth" that ensures every stakeholder understands their role within the broader system. This clarity allows leadership to establish a baseline for current performance, making it possible to measure the success of future state improvements against hard data rather than anecdotal evidence.
Eliminating Ambiguity: Defining exactly where one department's responsibility ends and another's begins.
Performance Baselining: Capturing "as-is" metrics to justify the ROI of digital transformation.
Structural Harmony: Ensuring that human workflows and ICT solutions are perfectly aligned.
Why Flowcharts Are Not Process Maps
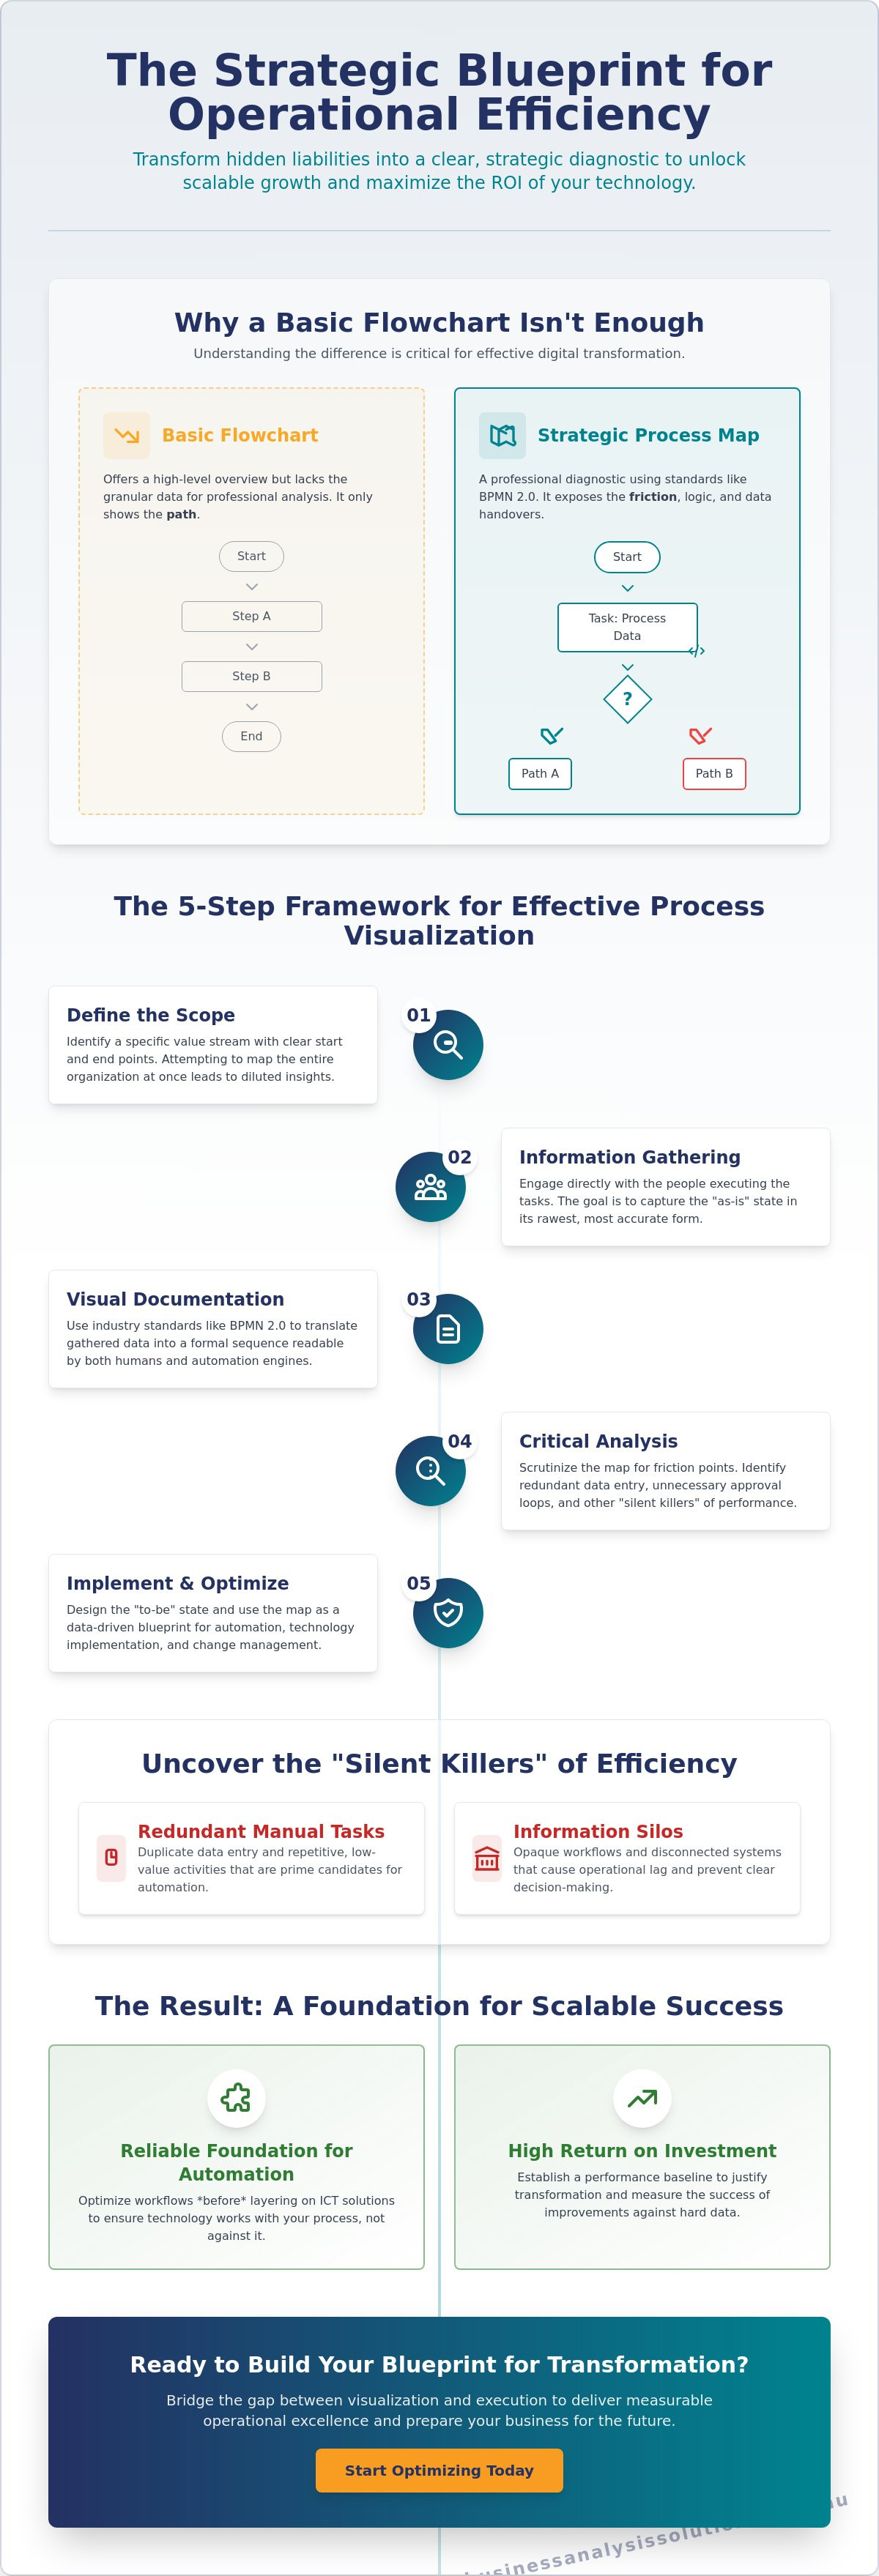
It's a common mistake to confuse a basic flowchart with a comprehensive process map. A flowchart typically offers a high-level overview of steps, but it lacks the granular data required for professional business efficiency. True process mapping incorporates business logic, decision points, and technical requirements. It uses standardized notations like BPMN 2.0 to ensure that the logic is readable by both human operators and automation engines.
A professional map accounts for the "silent killers" of efficiency, such as redundant data entry or unnecessary approval loops. Flowcharts show the path; process maps show the friction. By analyzing these granular details, you can identify which processes are candidates for Robotic Process Automation (RPA) and which require a fundamental structural redesign. Without this level of detail, technology investments often fail to deliver the promised results because the underlying process remains fundamentally broken.
The 5-Step Framework for Effective Process Visualization
Effective process visualization requires a structured methodology that moves from high-level observation to granular technical requirements. It isn't a creative exercise; it's a logical deconstruction of how work flows through your organization. By following a standardized framework, you ensure that process mapping for operational efficiency produces a reliable, data-driven diagnostic rather than a decorative chart. This sequence provides the clarity needed to identify where manual interventions are slowing down your growth.
Step 1: Define the Scope. Success begins by identifying a specific value stream with clear boundaries. Attempting to map the entire organization at once leads to diluted insights.
Step 2: Information Gathering. This phase involves direct engagement with the people executing the tasks. The goal is to capture the "as-is" state in its rawest form.
Step 3: Visual Documentation. Using industry standards like BPMN 2.0, you translate gathered data into a formal sequence of actors, decision points, and technical triggers.
Step 4: Critical Analysis. Here, you scrutinize the map for friction points, such as redundant data entry or approval loops that add no value.
Step 5: Future State Design. The final step involves creating an optimized blueprint that incorporates automation and removes identified bottlenecks.
Gathering Stakeholder Insights
The "as-is" state of a process often diverges significantly from what management believes is happening. Employees frequently develop manual workarounds or rely on "shadow IT" to overcome system limitations. Extracting these details requires a meticulous interviewing approach that prioritizes technical accuracy over surface-level descriptions. If you're looking to uncover these hidden operational gaps, you might consider how a professional business efficiency diagnostic can reveal the true state of your workflows.
Mapping for Scalability
Scaling an operation without a corresponding increase in headcount requires processes designed for high volume. A standardized map ensures that every team member follows the same logic, regardless of location or department. This consistency is the cornerstone of a digital transformation blueprint for business. When you standardize outputs and decision logic during the visualization phase, you create a system that can handle growth without adding administrative friction. This methodical preparation ensures that your technology investments are supported by a robust operational structure.
Identifying the 'Silent Killers' of Operational Efficiency
Identifying systemic friction requires a lens that looks beyond obvious errors. Process mapping for operational efficiency acts as a high-resolution diagnostic, revealing the "silent killers" that evade standard management reporting. These inefficiencies often reside in the gaps between departments or within the manual workarounds employees create to bypass legacy system limitations. When left unmapped, these issues compound, leading to significant margin erosion and operational lag.
Four primary factors typically undermine organizational performance:
The Hidden Cost of Redundancy: Tasks are often repeated unnecessarily because data isn't captured correctly at the source or systems don't communicate. This results in wasted labor hours on duplicate data entry.
The Information Silo Trap: Poor data handovers between teams create friction. When the receiving party lacks context, they must stop to seek clarification, which halts the momentum of the entire value stream.
Shadow Processes: These are the unofficial "fixes" employees develop to manage system flaws. While they keep things moving, they hide the root cause of the problem and prevent permanent resolution.
Decision Latency: Visualizing approval cycles often reveals where progress stalls. If a simple task requires multiple layers of management sign-off, the cost of the delay frequently exceeds the value of the oversight.
The Business Efficiency Diagnostic
Mapping serves as the objective foundation for a formal efficiency audit. By quantifying the time and capital lost to manual coordination, leadership can prioritize interventions based on strategic impact rather than guesswork. The process mining software market is projected to reach $5.45 billion in 2026, highlighting a global shift toward this data-driven analytical approach. This diagnostic ensures that every optimization effort is backed by logic and aimed at a specific, measurable financial outcome.
From Bottlenecks to Breakthroughs
Redesigning task handovers involves removing the "manager-approval" bottleneck that often adds days to a process without improving quality. Applying logical frameworks helps resolve these complex coordination issues by automating decision logic where possible. Systematically identifying and resolving a single core bottleneck within a primary value stream can unlock 20% more operational capacity without increasing your current headcount. This transition from visualization to resolution ensures that your operations remain lean and responsive to market demands.
Process Mapping as the Foundation for Automation
Automation is not a panacea for structural disorder. If you automate a chaotic, fragmented workflow, you simply accelerate the rate at which errors occur. Process mapping for operational efficiency provides the necessary logical framework to ensure that technology serves as a multiplier of success rather than a catalyst for accelerated failure. By deconstructing a process into its constituent parts, you can identify exactly which segments are ready for digital intervention and which require a fundamental structural redesign.
A comprehensive map identifies prime candidates for Robotic Process Automation (RPA) by highlighting tasks that meet three specific criteria: they are repetitive, rule-based, and high-volume. Without this visual diagnostic, organizations often waste capital on ICT solutions that fail to deliver a return on investment because the underlying business logic was never stabilized. Mapping ensures that every automated trigger is based on a "clean" process, preventing the "garbage in, garbage out" cycle that plagues many digital transformation projects.
Automation Readiness Assessment
Before integrating tools like the Microsoft Power Platform, you must conduct a formal readiness assessment through visualization. A clear map prevents scope creep by defining the exact boundaries of the automation project. It bridges the gap between high-level business requirements and technical execution, providing developers with a precise logic flow to follow. This methodical approach ensures that the resulting automation is both robust and scalable, handling increased workloads without requiring constant manual oversight or troubleshooting.
Integrating AI and Strategic Technology
The rise of hyperautomation and AI tools like Microsoft Copilot has changed the requirements for data architecture. AI systems thrive on structured data and predictable patterns; they cannot effectively navigate opaque or inconsistent workflows. Ensuring system harmony requires end-to-end process visibility so that machine learning outcomes are grounded in operational reality. With cloud-based deployment expected to account for 67.20% of the process software market in 2026, your processes must be digitally mature enough to reside in these integrated environments. If you are ready to stabilize your operations for the next level of growth, you can request an automation implementation consult to evaluate your current workflow maturity.
Strategic technology integration is only successful when it's preceded by rigorous analysis. By mapping your processes first, you create a data-driven blueprint that ensures your AI and automation investments are targeted at the areas of highest impact. This sequence transforms technology from a discretionary expense into a strategic asset that drives measurable operational excellence.
Implementing Change: From Visual Map to Measurable Outcome
A visual blueprint only delivers value when it is translated into a rigorous execution strategy. Moving from a "Future State" map to a measurable outcome requires a disciplined transition into an actionable project plan. This phase is where many organizations falter; they treat the map as a final destination rather than the starting point for systemic change. Effective process mapping for operational efficiency demands a commitment to implementation that is as meticulous as the diagnostic phase itself.
The transition from visualization to actualization depends heavily on expert project management to drive adoption across the organization. Without a structured approach to change, employees often revert to familiar, inefficient habits. Executive leadership must provide the necessary mandate to overcome this natural resistance, ensuring that the new workflows become the standard operating procedure rather than an optional suggestion. Success is measured through specific KPIs, such as cycle time reduction, throughput rates, and the elimination of manual touchpoints, which provide objective proof of progress.
The Role of the Fractional CIO
Leveraging Fractional CIO services provides the strategic leadership required to bridge the gap between technical requirements and organizational objectives. These experts ensure that every technical solution implemented is a direct resolution to a business problem identified during the mapping process. By aligning operational improvements with a long-term digital strategy, a Fractional CIO ensures that technology serves the business logic. This high-level oversight prevents the common mistake of investing in software that doesn't integrate with the broader operational ecosystem.
Sustaining Efficiency and Continuous Improvement
Achieving operational excellence isn't a one-time event; it requires a culture of process ownership and accountability. As your business scales, "process drift" can occur where informal workarounds begin to erode the efficiency gains you've established. Periodic reviews are essential to maintain system harmony and ensure that your workflows remain optimized for current volume and complexity. To maintain its relevance as a strategic asset, a process map must function as a living document that is formally reviewed on an annual basis to reflect evolving market conditions and internal capabilities.
When you tie these operational metrics to financial performance, such as reduced labor costs or improved margin per transaction, the value of process mapping for operational efficiency becomes undeniable to the board. It transforms your operations from a black box of hidden costs into a transparent, high-performance engine. This methodical approach ensures that your organization remains lean, agile, and prepared for the next stage of its digital evolution.
Securing Your Operational Future Through Precision
Transitioning from opaque workflows to a standardized, high-performance environment is a strategic imperative. By treating process mapping for operational efficiency as a rigorous diagnostic tool, you move beyond mere visualization. You establish the necessary logic to identify silent killers like redundancy and decision latency while building a stable foundation for hyperautomation. This methodical approach ensures that technology investments deliver a measurable financial return rather than just accelerating existing inefficiencies.
Success requires more than just a map; it demands the specialized leadership to execute change and bridge the gap between technical requirements and organizational objectives. With over 20 years of industry expertise, we specialize in delivering strategic outcomes that translate into tangible business value. If you're ready to stabilize your operations and prepare for the next stage of digital growth, book a Business Efficiency Diagnostic to identify your operational bottlenecks. Your organization's complexity can be resolved through a structured, methodical approach that prioritizes clarity and performance.
Frequently Asked Questions
What is the difference between process mapping and process modeling?
Process mapping focuses on the visual documentation of the "as-is" state to identify current logic and friction points. Process modeling is a more advanced phase that involves creating "should-be" simulations to test how changes in variables affect performance. While mapping provides the diagnostic, modeling allows you to predict the financial and operational impact of specific optimizations before implementation.
How long does a typical process mapping engagement take for an SME?
A standard engagement for a small to medium enterprise generally spans four to eight weeks. This timeline accounts for initial scoping, stakeholder interviews, and the development of the final diagnostic report. Complex value streams involving multiple departments or specialized ICT solutions may require additional time to ensure technical accuracy and stakeholder alignment.
Can process mapping help with compliance and regulatory audits?
Process mapping is an essential tool for meeting the rigorous documentation requirements of standards like ISO 9001:2026. It transforms opaque workflows into auditable sequences, ensuring that quality controls and ethical considerations are embedded directly into the process logic. This level of transparency simplifies the audit process and reduces the risk of non-compliance by establishing a clear "single source of truth."
Why do most internal process mapping projects fail to deliver ROI?
Internal projects often fail because they lack the objective distance required to identify "shadow processes" and manual workarounds. Employees are frequently too close to the work to see systemic flaws, leading to maps that describe how things "should" work rather than how they actually do. Without a structured project management framework to translate the map into action, the documentation remains a static asset with no impact on performance.
Is specialized software required for professional process mapping?
Professional results require tools that support standardized notation like BPMN 2.0. While basic diagrams can be made in general office software, specialized tools like Microsoft Visio or Lucidchart are necessary for technical precision. As of May 2026, Microsoft Visio Plan 2 costs $15 per user/month, providing the advanced features required to create maps that can be directly utilized for automation implementation.
How do I know which processes to map first for maximum efficiency?
Prioritize high-volume value streams that have a direct impact on your financial performance or customer experience. You should focus on areas where leadership suspects significant "decision latency" or where manual redundancies are clearly slowing down growth. Starting with these critical friction points ensures that your investment in process mapping for operational efficiency delivers the fastest and most visible return.
What is the role of a business analyst in the process mapping phase?
The business analyst serves as the objective architect who deconstructs complex organizational coordination into logical, technical requirements. They facilitate the extraction of insights from stakeholders and translate those raw details into a formal blueprint. Their primary goal is to bridge the gap between high-level business objectives and the granular logic required for successful operational improvement.
How does process mapping support a digital transformation strategy?
Process mapping serves as the diagnostic foundation for any digital transformation blueprint. It ensures that you don't waste capital automating a broken process, which only creates "faster" inefficiencies. By stabilizing the underlying logic first, you create an environment where new technology integrates seamlessly with your operations, ensuring that every ICT investment solves a verified business challenge.



Comments