Power BI in 2026: Transforming Raw Data into Strategic Business Intelligence
- jonesaqayalo
- Apr 16
- 12 min read
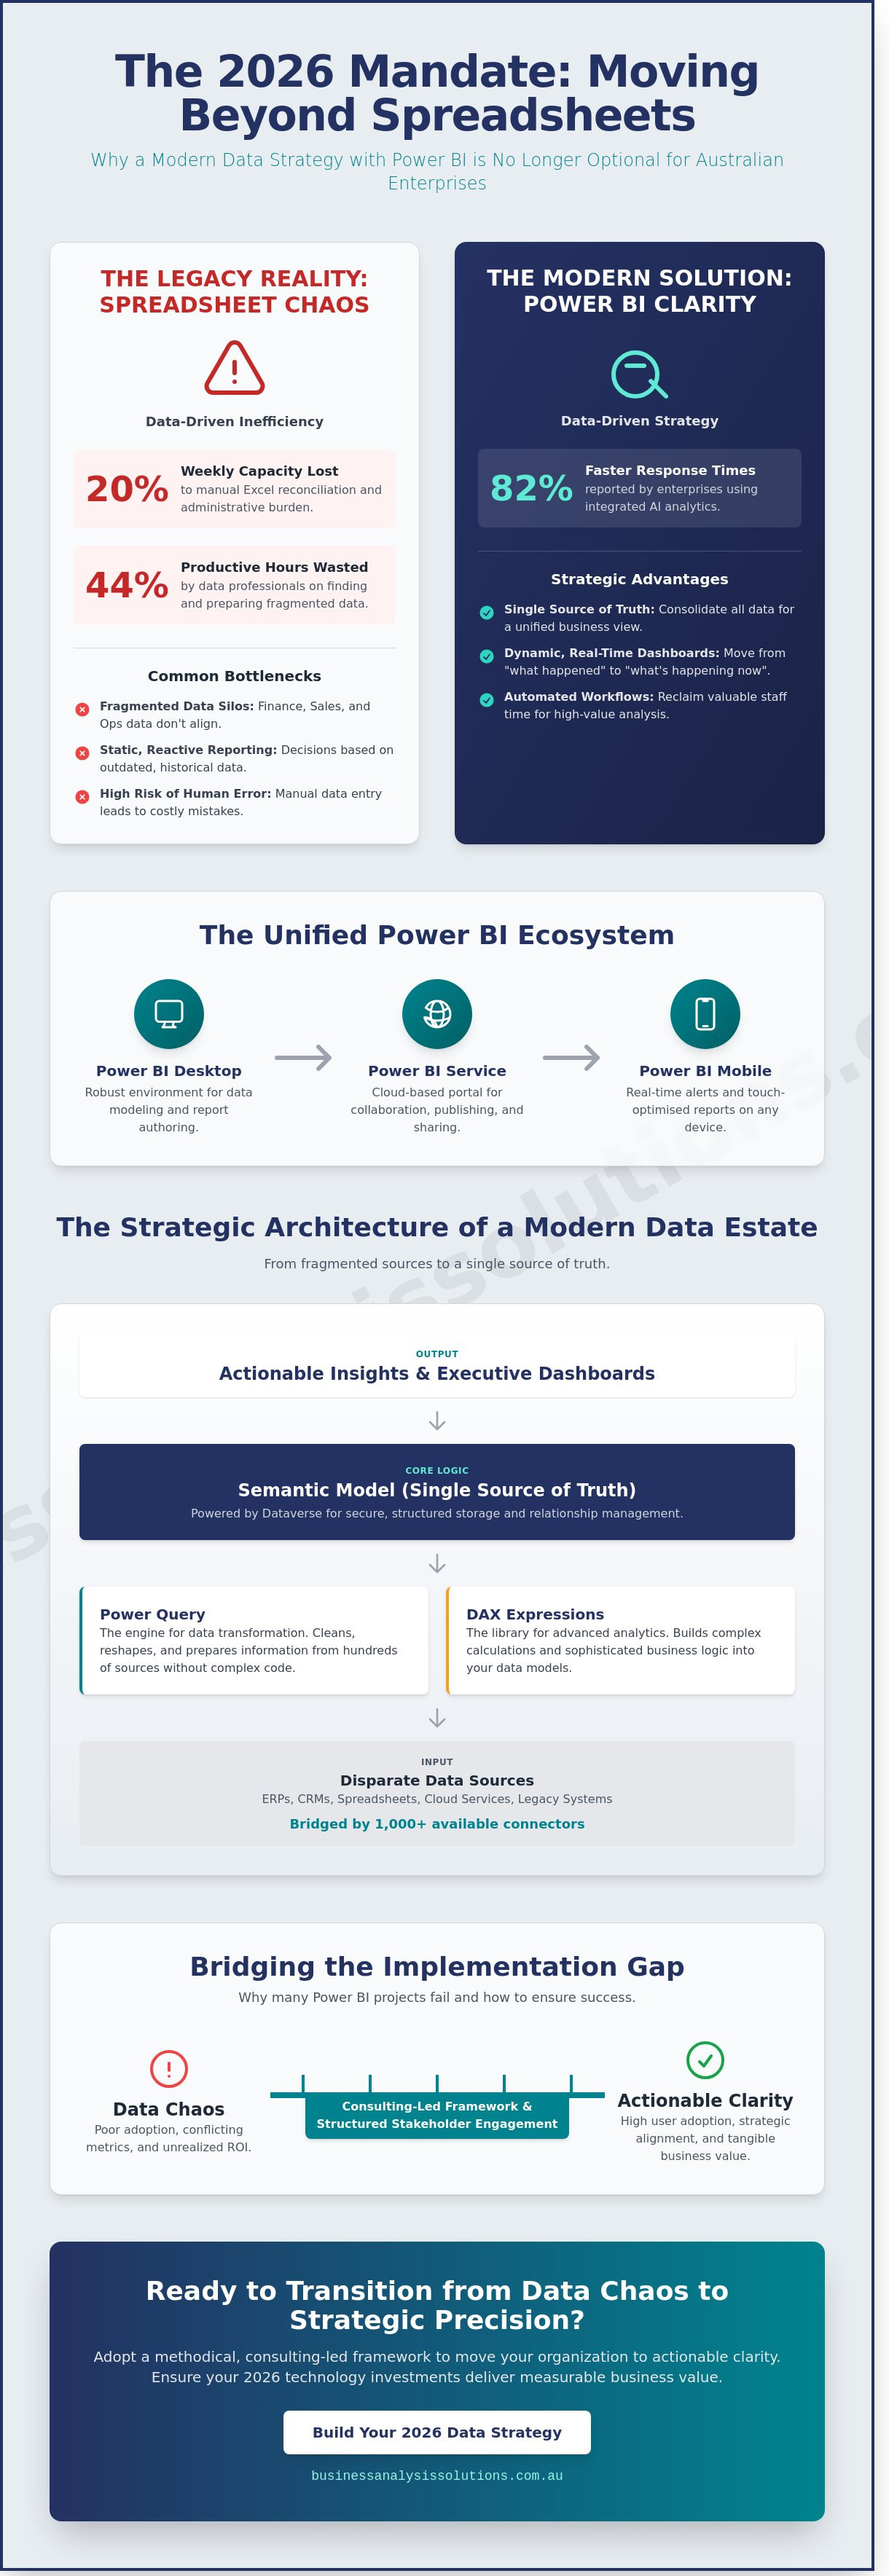
By 2026, the traditional spreadsheet will no longer serve as a viable foundation for enterprise-level decision making in Australia. You likely recognise the frustration of managing fragmented data across legacy systems while your team loses approximately 20% of their weekly capacity to manual Excel reconciliation. It's a common bottleneck that stifles growth and obscures the path to clear, actionable insights. Strategic implementation of Power BI is no longer just about creating visual dashboards; it's about establishing a robust framework for digital transformation that eliminates these inefficiencies at the source.
We agree that your data should work for you, rather than creating an ongoing administrative burden. This article demonstrates how to leverage this technology as a core pillar of your strategic decision making, ensuring your IT infrastructure aligns perfectly with your commercial objectives. You'll discover how to consolidate data silos into a single source of truth and automate workflows to reclaim valuable staff time for higher-value analysis. We'll examine the specific roadmap for integrating these solutions into your 2026 strategic plan to drive measurable performance and maintain a competitive edge in the local market.
Key Takeaways
Transition from static reporting to a unified platform designed for real-time data discovery and high-level strategic alignment.
Understand how a structured data architecture using Dataverse eliminates the operational inefficiencies inherent in fragmented data estates.
Identify the primary reasons powerbi implementations fail and learn to bridge the gap through structured stakeholder engagement.
Adopt a methodical, consulting-led framework to move your organization from data chaos to actionable clarity and precision.
Integrate automated reporting into your broader digital transformation strategy to ensure technology investments deliver tangible business value.
Table of Contents What is Power BI? Beyond Data Visualization The Strategic Architecture of a Modern Data Estate Why Power BI Projects Fail: The Implementation Gap A Framework for Successful Power BI Implementation Integrating Power BI into Your Digital Transformation Blueprint
What is Power BI? Beyond Data Visualization
Power BI functions as a unified business intelligence platform designed for comprehensive data discovery and secure sharing. It's no longer just a tool for generating charts; it's a strategic asset that converts fragmented data into a cohesive narrative for decision-makers. The platform facilitates a critical shift from static, reactive reporting to dynamic, real-time interactive dashboards. This allows leaders to move beyond viewing what happened last month to understanding what's happening this hour. By 2026, Microsoft Power BI has solidified its position as the central hub of the Microsoft Power Platform, providing the analytical engine that triggers automated workflows and custom business applications.
The system operates through three primary interfaces to ensure executive oversight at every level. Power BI Desktop provides the robust environment needed for data modeling and report authoring. The Power BI Service acts as the cloud-based collaboration portal where reports are published and shared. Finally, Power BI Mobile ensures that field-based executives and managers maintain visibility through real-time alerts and touch-optimised reports on their devices. This multi-layered approach ensures that data is accessible wherever a business decision needs to be made.
The Evolution of Business Intelligence in 2026
The current business environment in Australia demands a transition from reactive to predictive analytics. Built-in AI capabilities within the powerbi ecosystem now allow organisations to identify emerging trends and anomalies before they impact the bottom line. This technological advancement facilitates a genuine data-driven culture across all organisational levels, ensuring that even non-technical staff can interpret complex datasets. Recent industry benchmarks indicate that 82% of enterprises using integrated AI analytics report faster response times to market fluctuations. Power BI serves as the bridge between raw data and executive action.
Core Components of the Power BI Ecosystem
Precision in business analysis requires a structured approach to data handling. Power Query serves as the engine for data transformation, allowing analysts to clean and reshape information from hundreds of sources without writing complex code. For more sophisticated requirements, DAX (Data Analysis Expressions) provides the library of functions and operators needed to build complex calculations and logic. These elements combine to create semantic models, which function as the single source of truth for an entire organisation, eliminating the risks associated with conflicting spreadsheets.
For enterprise-grade operations, integration with Microsoft Fabric and OneLake is now standard. This setup allows for seamless data ingestion and storage, ensuring that large-scale datasets are managed within a governed environment. By centralising data in OneLake, businesses reduce redundancy and ensure that their powerbi reports are always drawing from the most current and verified information available in the corporate architecture.
The Strategic Architecture of a Modern Data Estate
A fragmented data estate isn't just a technical hurdle; it's a strategic bottleneck that causes data professionals to lose 44% of their productive hours every week according to IDC research. When information sits in isolated pockets, leaders make decisions based on incomplete or conflicting metrics. Establishing a robust powerbi environment requires more than just installing software; it demands a structured approach to data governance and strategic alignment between IT and operations. The true strength of this architecture lies in Dataverse. It provides a secure, structured storage solution for the entire Power Platform, allowing for seamless data relationship management across the enterprise.
By using over 1,000 available connectors, organisations bridge the gap between legacy on-premises systems and modern cloud analytics. This technical integration is a critical component of a digital transformation blueprint for business, ensuring that data moves fluidly without manual intervention. Technology remains only one part of the equation; the architecture must serve the broader business objectives to deliver a measurable return on investment.
Breaking Down Data Silos
Finance teams often track revenue in ERPs while sales teams monitor leads in separate CRMs. These silos obscure the big picture and lead to operational friction. Power BI aggregates these disparate sources to provide a single source of truth. For Australian organisations, this consolidation must respect strict security standards. Aligning your data architecture with the Essential 8 framework ensures that data integrity is maintained through rigorous access controls and patching protocols. This level of maturity is why powerbi consistently features as a leader in Gartner's Magic Quadrant for Analytics and BI Platforms. Establishing this foundation allows for real-time visibility across finance, sales, and operations simultaneously.
Leveraging AI and Copilot for Business Insights
AI integration via Copilot allows users to generate complex reports using natural language queries. Instead of manual sorting, the system identifies trends and anomalies that human analysts might overlook. For example, it can flag a 15% dip in regional sales before the month-end close, allowing for immediate corrective action. This speed is a competitive advantage in the Australian market. You must remember that AI insights are only as reliable as the underlying data quality. If your source data is poorly structured, the output will be flawed. For those ready to move beyond basic reporting, our team can help you optimise your data strategy to ensure your AI tools deliver accurate, actionable value.
Why Power BI Projects Fail: The Implementation Gap
Many Australian organisations invest in a powerbi license only to discover that their decision-making processes haven't improved. The failure rarely stems from the software itself. It originates in the implementation gap. Research from industry analysts indicates that roughly 80% of data projects fail to deliver tangible business value because they're treated as IT upgrades rather than strategic shifts. When leadership claims that BI didn't change anything, they're usually identifying a lack of stakeholder engagement from the outset.
A tool without a strategy is just an expensive way to see the same problems. Without deep requirements elicitation, developers build dashboards that look impressive but fail to answer critical commercial questions. Technical setup is the easy part. The difficulty lies in ensuring the data reflects the reality of the boardroom and the warehouse floor alike.
Tool-First vs. Strategy-First Approaches
The "buy a license and hope" method is a common pitfall for local SMEs. This reactive approach lacks the rigour of a strategic business analysis. A strategic approach ensures that every visual serves a specific operational goal. Engaging a Fractional CIO can provide the necessary oversight to align technical tools with commercial objectives, such as targeting an A$200,000 reduction in annual waste. Data cleansing is another vital step often ignored. If you feed "dirty data" into powerbi, the platform simply produces faster, more visually appealing errors. Clean data remains the prerequisite for any meaningful insight.
The Human Element in Data Transformation
Resistance to change is a primary project killer. People don't naturally trust new systems, especially when those systems challenge their long-held intuitions. Successful implementation requires a robust user adoption strategy. You need "data champions" within the organisation. These are influential staff members who bridge the gap between technical teams and end users. They help demystify the data and encourage their peers to rely on the new dashboard.
Clear KPIs must be defined before the first line of code is written. If an organisation hasn't agreed on what success looks like in plain English, it's impossible to measure it in a chart. We focus on these human and strategic elements to ensure the technology delivers a return on investment. Precision in the planning phase prevents the common cycle of expensive, abandoned software projects.
A Framework for Successful Power BI Implementation
Transitioning from fragmented data silos to a cohesive reporting ecosystem requires a methodology that mirrors a high-level consulting engagement. It isn't enough to simply connect powerbi to a database; success depends on a structured progression from chaos to clarity. This disciplined approach ensures that every visual serves a specific purpose, ultimately driving business efficiency across the organisation. By prioritising iterative development, we create feedback loops that allow the solution to evolve alongside shifting market conditions and internal requirements.
Step 1: Process Mapping and Requirements Elicitation
Before writing a single line of code, we identify the data touchpoints that define your unique business journey. This phase involves deep stakeholder engagement to determine exactly which metrics influence executive decision-making. We define the specific questions the tool must answer, such as identifying a 12% variance in project costs or tracking real-time lead conversion rates across different Australian territories. Process maps are the blueprint for data architecture. Without this foundational understanding, even the most visually appealing dashboard will fail to deliver strategic value or operational insight.
Step 2: Data Architecture and Governance
Reliability depends on establishing a "One Source of Truth" by consolidating disparate data streams into a centralised model. We implement row-level security to ensure sensitive financial or personnel data remains restricted to authorised users based on their specific organisational roles. Standardising naming conventions and DAX (Data Analysis Expressions) calculation logic prevents the ambiguity that often plagues unmanaged environments. This rigorous governance ensures that when a manager views a KPI, they're seeing data that's been validated against Australian accounting standards and specific internal benchmarks.
Step 3: Dashboard Design and User Training
Effective powerbi deployment focuses on minimalist design principles that prioritise actionable insights over visual clutter. We use drill-down capabilities to allow users to move from high-level summaries to granular transaction details in just two clicks. The final stage involves a formal hand-over process, including targeted user training and documentation to ensure long-term adoption. We've found that structured training increases tool utilisation by 65% within the first 90 days of deployment. Our ongoing support ensures the system remains robust as your data volume grows and your business scales.
Ready to transform your organisational data into a strategic asset? Partner with our analytical experts to build a custom reporting framework today.
Integrating Power BI into Your Digital Transformation Blueprint
Successful digital transformation requires more than adopting isolated tools; it demands a cohesive business technology strategy where every asset serves a specific commercial purpose. Within this framework, powerbi acts as the connective tissue between disparate data sources and executive decision-making. It's not merely a reporting layer. It's a foundational element that enables a culture of transparency. When you implement automated reporting, you create a feedback loop that feeds directly into broader automation projects. For instance, when a dashboard identifies a recurring bottleneck in supply chain logistics, it provides the empirical evidence needed to justify investment in robotic process automation for warehouse management. Australian firms that leverage these integrated insights often reduce manual data processing time by up to 35% within the first twelve months of implementation.
The Role of the Fractional CIO in Data Strategy
High-level advisory ensures your powerbi environment evolves alongside your growing business requirements. Many mid-market Australian companies face a gap between technical capability and strategic vision. This is where a Fractional CIO becomes essential. They provide executive-grade IT leadership on an on-demand basis, ensuring that your data estate remains healthy and scalable. From a cost-benefit perspective, this model is highly efficient. You access the expertise of a seasoned professional without committing to the A$280,000 plus annual salary associated with a full-time Chief Information Officer. The Fractional CIO focuses on the strategic alignment between ICT and business goals, ensuring that every dashboard and data model contributes directly to the bottom line. They manage technical debt and ensure your data governance protocols comply with the latest Australian privacy standards.
Next Steps: The Business Efficiency Diagnostic
Most organisations recognise they have a data problem but struggle to identify the exact point of failure. The Business Efficiency Diagnostic is the logical first step for leaders who need to assess their current data maturity. This structured assessment identifies the highest-ROI opportunities for business intelligence by mapping your existing workflows against industry benchmarks. We look for manual interventions that drive up operational costs and identify where data silos are hindering growth. Data visibility is the primary driver of organisational agility. It allows your team to pivot quickly when market conditions shift, moving from reactive fire-fighting to proactive strategy. Clarity in your data leads to confidence in your execution.
Ready to move beyond static spreadsheets and embrace a data-driven future? Book a consultation to begin your digital transformation journey and discover how a structured approach to business analysis can unlock your firm's potential.
Securing Your Competitive Advantage Through Data Maturity
By 2026, the distinction between market leaders and laggards will rest on how effectively they navigate the transition from raw data to strategic intelligence. Successful powerbi deployment isn't merely about dashboard creation; it's about building a robust data estate that aligns technical infrastructure with clear commercial outcomes. We've identified that most implementation failures stem from a lack of strategic alignment, yet this risk is avoidable with a methodical approach to your digital transformation blueprint.
Business Analysis & Solutions brings over 20 years of ICT strategy experience to help Australian organisations bridge the gap between complex technical requirements and high-level business goals. We've seen that a structured framework reduces implementation friction and ensures every data point serves a specific purpose. It's time to move beyond static reporting and embrace a dynamic, insights-driven culture that delivers a measurable return on investment. Your data holds the answers to future efficiency gains, provided you have the right architecture to extract them.
Request a Business Efficiency Diagnostic to uncover your data potential and ensure your organisation is ready for the challenges of the next decade. We're here to help you turn technical complexity into a clear, actionable roadmap for success.
Frequently Asked Questions
What is the difference between Power BI Free, Pro, and Premium?
Power BI Free is designed for personal use, while Power BI Pro enables collaborative report sharing for A$14.90 per user per month. Power BI Premium provides advanced AI capabilities and handles larger data volumes, starting at A$29.80 per user per month. Large organisations often choose Premium per capacity at A$7,438.20 monthly to support thousands of users. These tiers ensure your licensing aligns with your specific strategic alignment and scalability requirements.
Can Power BI connect to my existing legacy software or ERP?
Power BI connects to legacy systems and ERPs using over 70 native connectors or the On-premises Data Gateway. This secure bridge allows the cloud service to query local databases without moving the raw data from your servers. We utilise process mapping to identify specific integration points for systems like SAP or older SQL Server versions. This ensures your existing infrastructure remains a viable source for modern business intelligence solutions.
How long does a typical Power BI implementation take for a mid-sized business?
A typical implementation for an Australian mid-sized business takes between 4 and 12 weeks. The first 14 days focus on requirements elicitation and data source connection to ensure accuracy. Following this, 6 to 8 weeks are dedicated to data modelling and dashboard development. This structured timeline ensures the solution delivers a measurable return on investment while maintaining high data integrity standards across your entire organisation.
Is my data secure when using a cloud-based BI tool like Power BI?
Your data remains secure through Microsoft's multi layered security architecture and local Australian data centres. Power BI employs AES 256 bit encryption for data at rest and TLS 1.2 for data in transit. It integrates with Microsoft Purview Information Protection to apply sensitivity labels that prevent unauthorised exports. These protocols ensure compliance with local privacy standards while maintaining rigorous stakeholder engagement through controlled access.
Do I need a full-time data scientist to manage Power BI?
You don't need a full time data scientist to manage powerbi effectively. The platform is designed for business analysts who understand the logic of their specific industry. While initial setup benefits from expert architectural design, daily management involves low code tools that your existing team can master quickly. This approach reduces overhead costs and ensures that those closest to the business problems are the ones building the solutions.
What is the "Essential 8" and how does it relate to my data reporting?
The Essential 8 is a series of baseline mitigation strategies developed by the Australian Signals Directorate to protect against cyber threats. Power BI facilitates compliance by tracking patching rates, multi factor authentication adoption, and administrative privilege changes across your network. By visualising these metrics, IT leaders can demonstrate strategic alignment with government security frameworks. This proactive monitoring identifies vulnerabilities before they result in a data breach.
Can Power BI help with my ESG reporting and compliance?
Power BI streamlines ESG reporting by consolidating environmental, social, and governance data into a single source of truth. It tracks specific metrics such as Scope 1 and 2 emissions or workforce diversity percentages required for Australian regulatory disclosures. Using automated data refreshes ensures your reports reflect current performance rather than outdated estimates. This transparency builds trust with investors and ensures compliance with evolving international sustainability standards.
How does Power BI compare to Excel for business reporting?
Power BI outperforms Excel when handling massive datasets that exceed the standard 1,048,576 row limit. While Excel remains effective for ad hoc calculations, powerbi provides automated data refreshes and interactive visualisations that spreadsheets cannot match. It shifts the focus from manual data entry to strategic analysis. This transition improves efficiency by reducing human error and providing a unified view of performance across all your departments.


Comments